
 Yahoo Finance
 Be Wary Of Irish Continental Group (LON:ICGC) And Its Returns On Capital
Finding a business that has the potential to grow substantially is not easy, but it is possible if we look at a few key financial metrics. One common approach is to try and find a company with returns on capital employed (ROCE) that are increasing, in conjunction with a growing amount of capital employed. This shows us that it's a compounding machine, able to continually reinvest its earnings back into the business and generate higher returns. In light of that, when we looked at Irish Continental Group (LON:ICGC) and its ROCE trend, we weren't exactly thrilled.
Return On Capital Employed (ROCE): What Is It?
Just to clarify if you're unsure, ROCE is a metric for evaluating how much pre-tax income (in percentage terms) a company earns on the capital invested in its business. The formula for this calculation on Irish Continental Group is:
Return on Capital Employed = Earnings Before Interest and Tax (EBIT) ÷ (Total Assets - Current Liabilities)
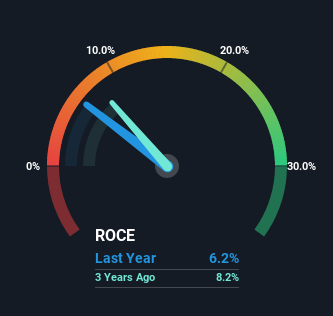
0.062 = €26m ÷ (€604m - €181m) (Based on the trailing twelve months to June 2022).
Therefore, Irish Continental Group has an ROCE of 6.2%. Ultimately, that's a low return and it under-performs the Shipping industry average of 11%.
View our latest analysis for Irish Continental Group
In the above chart we have measured Irish Continental Group's prior ROCE against its prior performance, but the future is arguably more important. If you'd like, you can check out the forecasts from the analysts covering Irish Continental Group here for free.
How Are Returns Trending?
When we looked at the ROCE trend at Irish Continental Group, we didn't gain much confidence. Around five years ago the returns on capital were 31%, but since then they've fallen to 6.2%. Although, given both revenue and the amount of assets employed in the business have increased, it could suggest the company is investing in growth, and the extra capital has led to a short-term reduction in ROCE. And if the increased capital generates additional returns, the business, and thus shareholders, will benefit in the long run.
The Key Takeaway
In summary, despite lower returns in the short term, we're encouraged to see that Irish Continental Group is reinvesting for growth and has higher sales as a result. And there could be an opportunity here if other metrics look good too, because the stock has declined 19% in the last five years. So we think it'd be worthwhile to look further into this stock given the trends look encouraging.
On a final note, we found 3 warning signs for Irish Continental Group (2 can't be ignored) you should be aware of.
If you want to search for solid companies with great earnings, check out this free list of companies with good balance sheets and impressive returns on equity.
Have feedback on this article? Concerned about the content? Get in touch with us directly. Alternatively, email editorial-team (at) simplywallst.com.
This article by Simply Wall St is general in nature. We provide commentary based on historical data and analyst forecasts only using an unbiased methodology and our articles are not intended to be financial advice. It does not constitute a recommendation to buy or sell any stock, and does not take account of your objectives, or your financial situation. We aim to bring you long-term focused analysis driven by fundamental data. Note that our analysis may not factor in the latest price-sensitive company announcements or qualitative material. Simply Wall St has no position in any stocks mentioned.
Join A Paid User Research Session
You’ll receive a US$30 Amazon Gift card for 1 hour of your time while helping us build better investing tools for the individual investors like yourself. Sign up here
