
 Yahoo Finance
 Be Wary Of JD Sports Fashion (LON:JD.) And Its Returns On Capital
If we want to find a stock that could multiply over the long term, what are the underlying trends we should look for? Amongst other things, we'll want to see two things; firstly, a growing return on capital employed (ROCE) and secondly, an expansion in the company's amount of capital employed. Ultimately, this demonstrates that it's a business that is reinvesting profits at increasing rates of return. Although, when we looked at JD Sports Fashion (LON:JD.), it didn't seem to tick all of these boxes.
What is Return On Capital Employed (ROCE)?
Just to clarify if you're unsure, ROCE is a metric for evaluating how much pre-tax income (in percentage terms) a company earns on the capital invested in its business. The formula for this calculation on JD Sports Fashion is:
Return on Capital Employed = Earnings Before Interest and Tax (EBIT) ÷ (Total Assets - Current Liabilities)
0.19 = UK£868m ÷ (UK£6.5b - UK£1.8b) (Based on the trailing twelve months to July 2021).
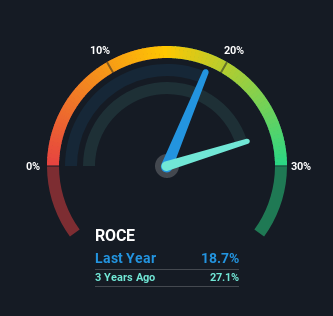
Thus, JD Sports Fashion has an ROCE of 19%. On its own, that's a standard return, however it's much better than the 15% generated by the Specialty Retail industry.
See our latest analysis for JD Sports Fashion
In the above chart we have measured JD Sports Fashion's prior ROCE against its prior performance, but the future is arguably more important. If you'd like, you can check out the forecasts from the analysts covering JD Sports Fashion here for free.
How Are Returns Trending?
In terms of JD Sports Fashion's historical ROCE movements, the trend isn't fantastic. Around five years ago the returns on capital were 38%, but since then they've fallen to 19%. However, given capital employed and revenue have both increased it appears that the business is currently pursuing growth, at the consequence of short term returns. And if the increased capital generates additional returns, the business, and thus shareholders, will benefit in the long run.
On a side note, JD Sports Fashion has done well to pay down its current liabilities to 28% of total assets. So we could link some of this to the decrease in ROCE. Effectively this means their suppliers or short-term creditors are funding less of the business, which reduces some elements of risk. Some would claim this reduces the business' efficiency at generating ROCE since it is now funding more of the operations with its own money.
The Key Takeaway
In summary, despite lower returns in the short term, we're encouraged to see that JD Sports Fashion is reinvesting for growth and has higher sales as a result. And the stock has followed suit returning a meaningful 80% to shareholders over the last five years. So should these growth trends continue, we'd be optimistic on the stock going forward.
On a separate note, we've found 1 warning sign for JD Sports Fashion you'll probably want to know about.
While JD Sports Fashion isn't earning the highest return, check out this free list of companies that are earning high returns on equity with solid balance sheets.
Have feedback on this article? Concerned about the content? Get in touch with us directly. Alternatively, email editorial-team (at) simplywallst.com.
This article by Simply Wall St is general in nature. We provide commentary based on historical data and analyst forecasts only using an unbiased methodology and our articles are not intended to be financial advice. It does not constitute a recommendation to buy or sell any stock, and does not take account of your objectives, or your financial situation. We aim to bring you long-term focused analysis driven by fundamental data. Note that our analysis may not factor in the latest price-sensitive company announcements or qualitative material. Simply Wall St has no position in any stocks mentioned.
