
 Yahoo Finance
 Be Wary Of LPA Group (LON:LPA) And Its Returns On Capital
When it comes to investing, there are some useful financial metrics that can warn us when a business is potentially in trouble. A business that's potentially in decline often shows two trends, a return on capital employed (ROCE) that's declining, and a base of capital employed that's also declining. Ultimately this means that the company is earning less per dollar invested and on top of that, it's shrinking its base of capital employed. Having said that, after a brief look, LPA Group (LON:LPA) we aren't filled with optimism, but let's investigate further.
Return On Capital Employed (ROCE): What Is It?
For those that aren't sure what ROCE is, it measures the amount of pre-tax profits a company can generate from the capital employed in its business. The formula for this calculation on LPA Group is:
Return on Capital Employed = Earnings Before Interest and Tax (EBIT) ÷ (Total Assets - Current Liabilities)
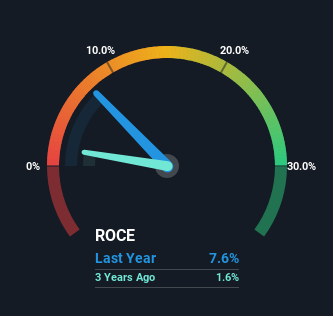
0.076 = UK£1.1m ÷ (UK£22m - UK£6.9m) (Based on the trailing twelve months to March 2023).
So, LPA Group has an ROCE of 7.6%. In absolute terms, that's a low return and it also under-performs the Electrical industry average of 10%.
See our latest analysis for LPA Group
Above you can see how the current ROCE for LPA Group compares to its prior returns on capital, but there's only so much you can tell from the past. If you'd like to see what analysts are forecasting going forward, you should check out our free report for LPA Group.
What Can We Tell From LPA Group's ROCE Trend?
In terms of LPA Group's historical ROCE movements, the trend doesn't inspire confidence. Unfortunately the returns on capital have diminished from the 17% that they were earning five years ago. Meanwhile, capital employed in the business has stayed roughly the flat over the period. Companies that exhibit these attributes tend to not be shrinking, but they can be mature and facing pressure on their margins from competition. If these trends continue, we wouldn't expect LPA Group to turn into a multi-bagger.
The Bottom Line
All in all, the lower returns from the same amount of capital employed aren't exactly signs of a compounding machine. It should come as no surprise then that the stock has fallen 17% over the last five years, so it looks like investors are recognizing these changes. Unless there is a shift to a more positive trajectory in these metrics, we would look elsewhere.
LPA Group does come with some risks though, we found 2 warning signs in our investment analysis, and 1 of those makes us a bit uncomfortable...
While LPA Group may not currently earn the highest returns, we've compiled a list of companies that currently earn more than 25% return on equity. Check out this free list here.
Have feedback on this article? Concerned about the content? Get in touch with us directly. Alternatively, email editorial-team (at) simplywallst.com.
This article by Simply Wall St is general in nature. We provide commentary based on historical data and analyst forecasts only using an unbiased methodology and our articles are not intended to be financial advice. It does not constitute a recommendation to buy or sell any stock, and does not take account of your objectives, or your financial situation. We aim to bring you long-term focused analysis driven by fundamental data. Note that our analysis may not factor in the latest price-sensitive company announcements or qualitative material. Simply Wall St has no position in any stocks mentioned.
