
 Yahoo Finance
 Be Wary Of VAALCO Energy (NYSE:EGY) And Its Returns On Capital
There are a few key trends to look for if we want to identify the next multi-bagger. In a perfect world, we'd like to see a company investing more capital into its business and ideally the returns earned from that capital are also increasing. Ultimately, this demonstrates that it's a business that is reinvesting profits at increasing rates of return. So when we looked at VAALCO Energy (NYSE:EGY), they do have a high ROCE, but we weren't exactly elated from how returns are trending.
Understanding Return On Capital Employed (ROCE)
If you haven't worked with ROCE before, it measures the 'return' (pre-tax profit) a company generates from capital employed in its business. To calculate this metric for VAALCO Energy, this is the formula:
Return on Capital Employed = Earnings Before Interest and Tax (EBIT) ÷ (Total Assets - Current Liabilities)
0.28 = US$54m ÷ (US$309m - US$118m) (Based on the trailing twelve months to March 2022).
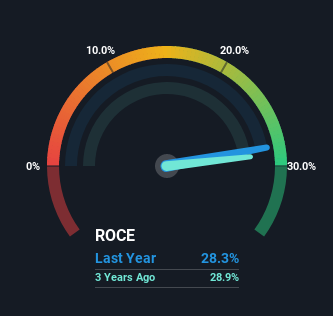
So, VAALCO Energy has an ROCE of 28%. That's a fantastic return and not only that, it outpaces the average of 12% earned by companies in a similar industry.
Check out our latest analysis for VAALCO Energy
In the above chart we have measured VAALCO Energy's prior ROCE against its prior performance, but the future is arguably more important. If you're interested, you can view the analysts predictions in our free report on analyst forecasts for the company.
What Can We Tell From VAALCO Energy's ROCE Trend?
In terms of VAALCO Energy's historical ROCE movements, the trend isn't fantastic. While it's comforting that the ROCE is high, five years ago it was 59%. However, given capital employed and revenue have both increased it appears that the business is currently pursuing growth, at the consequence of short term returns. If these investments prove successful, this can bode very well for long term stock performance.
On a side note, VAALCO Energy has done well to pay down its current liabilities to 38% of total assets. That could partly explain why the ROCE has dropped. What's more, this can reduce some aspects of risk to the business because now the company's suppliers or short-term creditors are funding less of its operations. Since the business is basically funding more of its operations with it's own money, you could argue this has made the business less efficient at generating ROCE.
Our Take On VAALCO Energy's ROCE
In summary, despite lower returns in the short term, we're encouraged to see that VAALCO Energy is reinvesting for growth and has higher sales as a result. And long term investors must be optimistic going forward because the stock has returned a huge 755% to shareholders in the last five years. So should these growth trends continue, we'd be optimistic on the stock going forward.
If you want to know some of the risks facing VAALCO Energy we've found 4 warning signs (2 make us uncomfortable!) that you should be aware of before investing here.
High returns are a key ingredient to strong performance, so check out our free list ofstocks earning high returns on equity with solid balance sheets.
Have feedback on this article? Concerned about the content? Get in touch with us directly. Alternatively, email editorial-team (at) simplywallst.com.
This article by Simply Wall St is general in nature. We provide commentary based on historical data and analyst forecasts only using an unbiased methodology and our articles are not intended to be financial advice. It does not constitute a recommendation to buy or sell any stock, and does not take account of your objectives, or your financial situation. We aim to bring you long-term focused analysis driven by fundamental data. Note that our analysis may not factor in the latest price-sensitive company announcements or qualitative material. Simply Wall St has no position in any stocks mentioned.
