
 Yahoo Finance
 WashTec (ETR:WSU) Will Be Hoping To Turn Its Returns On Capital Around
What underlying fundamental trends can indicate that a company might be in decline? Businesses in decline often have two underlying trends, firstly, a declining return on capital employed (ROCE) and a declining base of capital employed. This combination can tell you that not only is the company investing less, it's earning less on what it does invest. So after we looked into WashTec (ETR:WSU), the trends above didn't look too great.
What Is Return On Capital Employed (ROCE)?
For those who don't know, ROCE is a measure of a company's yearly pre-tax profit (its return), relative to the capital employed in the business. To calculate this metric for WashTec, this is the formula:
Return on Capital Employed = Earnings Before Interest and Tax (EBIT) ÷ (Total Assets - Current Liabilities)
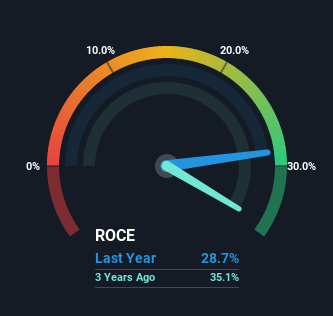
0.29 = €30m ÷ (€289m - €184m) (Based on the trailing twelve months to September 2022).
Therefore, WashTec has an ROCE of 29%. In absolute terms that's a great return and it's even better than the Machinery industry average of 8.8%.
Check out our latest analysis for WashTec
Above you can see how the current ROCE for WashTec compares to its prior returns on capital, but there's only so much you can tell from the past. If you'd like to see what analysts are forecasting going forward, you should check out our free report for WashTec.
What Does the ROCE Trend For WashTec Tell Us?
There is reason to be cautious about WashTec, given the returns are trending downwards. About five years ago, returns on capital were 53%, however they're now substantially lower than that as we saw above. And on the capital employed front, the business is utilizing roughly the same amount of capital as it was back then. Since returns are falling and the business has the same amount of assets employed, this can suggest it's a mature business that hasn't had much growth in the last five years. If these trends continue, we wouldn't expect WashTec to turn into a multi-bagger.
On a separate but related note, it's important to know that WashTec has a current liabilities to total assets ratio of 64%, which we'd consider pretty high. This can bring about some risks because the company is basically operating with a rather large reliance on its suppliers or other sorts of short-term creditors. While it's not necessarily a bad thing, it can be beneficial if this ratio is lower.
What We Can Learn From WashTec's ROCE
All in all, the lower returns from the same amount of capital employed aren't exactly signs of a compounding machine. Long term shareholders who've owned the stock over the last five years have experienced a 39% depreciation in their investment, so it appears the market might not like these trends either. Unless there is a shift to a more positive trajectory in these metrics, we would look elsewhere.
If you'd like to know more about WashTec, we've spotted 2 warning signs, and 1 of them can't be ignored.
If you want to search for more stocks that have been earning high returns, check out this free list of stocks with solid balance sheets that are also earning high returns on equity.
Have feedback on this article? Concerned about the content? Get in touch with us directly. Alternatively, email editorial-team (at) simplywallst.com.
This article by Simply Wall St is general in nature. We provide commentary based on historical data and analyst forecasts only using an unbiased methodology and our articles are not intended to be financial advice. It does not constitute a recommendation to buy or sell any stock, and does not take account of your objectives, or your financial situation. We aim to bring you long-term focused analysis driven by fundamental data. Note that our analysis may not factor in the latest price-sensitive company announcements or qualitative material. Simply Wall St has no position in any stocks mentioned.
Join A Paid User Research Session
You’ll receive a US$30 Amazon Gift card for 1 hour of your time while helping us build better investing tools for the individual investors like yourself. Sign up here
