
 Yahoo Finance
 Watkin Jones Plc (LON:WJG) is largely controlled by institutional shareholders who own 60% of the company
Key Insights
Significantly high institutional ownership implies Watkin Jones' stock price is sensitive to their trading actions
The top 9 shareholders own 50% of the company
Ownership research along with analyst forecasts data help provide a good understanding of opportunities in a stock
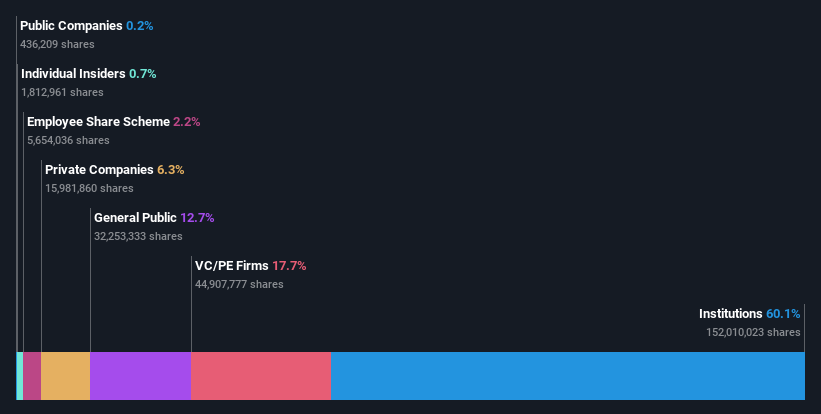
If you want to know who really controls Watkin Jones Plc (LON:WJG), then you'll have to look at the makeup of its share registry. We can see that institutions own the lion's share in the company with 60% ownership. Put another way, the group faces the maximum upside potential (or downside risk).
Given the vast amount of money and research capacities at their disposal, institutional ownership tends to carry a lot of weight, especially with individual investors. Therefore, a good portion of institutional money invested in the company is usually a huge vote of confidence on its future.
Let's delve deeper into each type of owner of Watkin Jones, beginning with the chart below.
See our latest analysis for Watkin Jones
What Does The Institutional Ownership Tell Us About Watkin Jones?
Many institutions measure their performance against an index that approximates the local market. So they usually pay more attention to companies that are included in major indices.
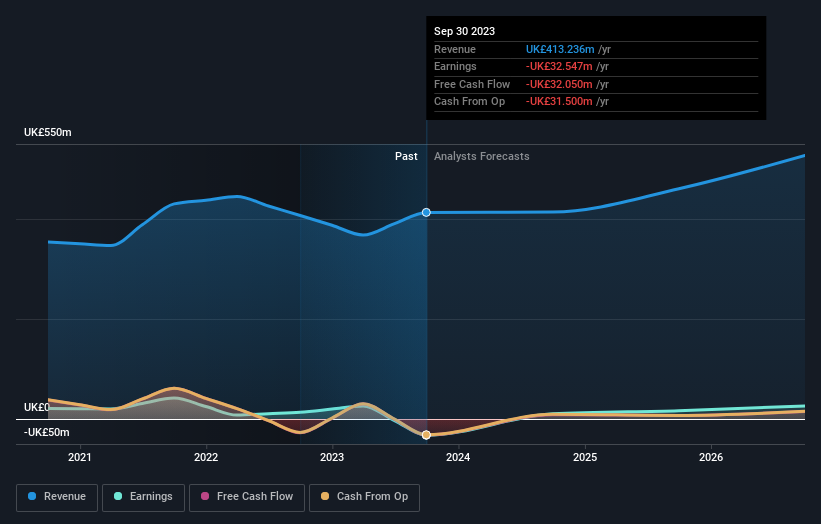
Watkin Jones already has institutions on the share registry. Indeed, they own a respectable stake in the company. This can indicate that the company has a certain degree of credibility in the investment community. However, it is best to be wary of relying on the supposed validation that comes with institutional investors. They too, get it wrong sometimes. When multiple institutions own a stock, there's always a risk that they are in a 'crowded trade'. When such a trade goes wrong, multiple parties may compete to sell stock fast. This risk is higher in a company without a history of growth. You can see Watkin Jones' historic earnings and revenue below, but keep in mind there's always more to the story.
Since institutional investors own more than half the issued stock, the board will likely have to pay attention to their preferences. Hedge funds don't have many shares in Watkin Jones. Octopus Investments Limited is currently the largest shareholder, with 11% of shares outstanding. Meanwhile, the second and third largest shareholders, hold 8.2% and 6.6%, of the shares outstanding, respectively.
We also observed that the top 9 shareholders account for more than half of the share register, with a few smaller shareholders to balance the interests of the larger ones to a certain extent.
While studying institutional ownership for a company can add value to your research, it is also a good practice to research analyst recommendations to get a deeper understand of a stock's expected performance. There are a reasonable number of analysts covering the stock, so it might be useful to find out their aggregate view on the future.
Insider Ownership Of Watkin Jones
The definition of company insiders can be subjective and does vary between jurisdictions. Our data reflects individual insiders, capturing board members at the very least. The company management answer to the board and the latter should represent the interests of shareholders. Notably, sometimes top-level managers are on the board themselves.
I generally consider insider ownership to be a good thing. However, on some occasions it makes it more difficult for other shareholders to hold the board accountable for decisions.
Our data suggests that insiders own under 1% of Watkin Jones Plc in their own names. However, it's possible that insiders might have an indirect interest through a more complex structure. It seems the board members have no more than UK£738k worth of shares in the UK£103m company. Many tend to prefer to see a board with bigger shareholdings. A good next step might be to take a look at this free summary of insider buying and selling.
General Public Ownership
With a 13% ownership, the general public, mostly comprising of individual investors, have some degree of sway over Watkin Jones. While this size of ownership may not be enough to sway a policy decision in their favour, they can still make a collective impact on company policies.
Private Equity Ownership
Private equity firms hold a 18% stake in Watkin Jones. This suggests they can be influential in key policy decisions. Sometimes we see private equity stick around for the long term, but generally speaking they have a shorter investment horizon and -- as the name suggests -- don't invest in public companies much. After some time they may look to sell and redeploy capital elsewhere.
Private Company Ownership
We can see that Private Companies own 6.3%, of the shares on issue. It might be worth looking deeper into this. If related parties, such as insiders, have an interest in one of these private companies, that should be disclosed in the annual report. Private companies may also have a strategic interest in the company.
Next Steps:
I find it very interesting to look at who exactly owns a company. But to truly gain insight, we need to consider other information, too.
Many find it useful to take an in depth look at how a company has performed in the past. You can access this detailed graph of past earnings, revenue and cash flow.
Ultimately the future is most important. You can access this free report on analyst forecasts for the company.
NB: Figures in this article are calculated using data from the last twelve months, which refer to the 12-month period ending on the last date of the month the financial statement is dated. This may not be consistent with full year annual report figures.
Have feedback on this article? Concerned about the content? Get in touch with us directly. Alternatively, email editorial-team (at) simplywallst.com.
This article by Simply Wall St is general in nature. We provide commentary based on historical data and analyst forecasts only using an unbiased methodology and our articles are not intended to be financial advice. It does not constitute a recommendation to buy or sell any stock, and does not take account of your objectives, or your financial situation. We aim to bring you long-term focused analysis driven by fundamental data. Note that our analysis may not factor in the latest price-sensitive company announcements or qualitative material. Simply Wall St has no position in any stocks mentioned.
