
 Yahoo Finance
 Wayfair (W) Q1 Loss Narrower Than Expected, Revenues Decline Y/Y
Wayfair W reported a non-GAAP loss of $1.13 per share for first-quarter 2023, narrower than the Zacks Consensus Estimate for a loss of $1.72 per share. The figure was also narrower than the loss of $1.96 per share reported in the year-ago quarter.
Total net revenues of $2.77 billion beat the consensus mark of $2.74 billion. However, the top line declined 7.3% year over year.
The top-line decrease was due to declining domestic and international revenues. A fall in active customers affected the results.
Quarter in Detail
Net revenues in the United States decreased 5% year over year to $2.4 billion. International net revenues declined 20.4% from the prior-year quarter’s figure to $359 million.
Active customers were down 14.6% year over year to 21.7 million. In addition, LTM net revenues per active customer increased 6.2% year over year to $552. The average order value remained flat year over year at $287.
The total number of orders delivered in the reported quarter was 9.7 million, down 6.7% year over year. In addition, orders per customer for the quarter were 1.81 compared with 1.87 in the year-ago period.
Repeat customers placed 7.6 million orders (accounting for 79.1% of total orders) in the first quarter, down 6.2% year over year.
Additionally, 62.1% of the total orders delivered were placed through a mobile device in the reported quarter compared with 59.4% in the year-ago period.
Wayfair Inc. Price, Consensus and EPS Surprise
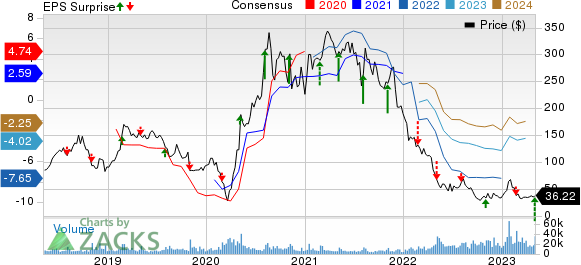
Wayfair Inc. price-consensus-eps-surprise-chart | Wayfair Inc. Quote
Operating Results
Wayfair’s first-quarter gross margin was 29.6%, expanding 280 basis points on a year-over-year basis.
Adjusted EBITDA was ($14) million versus ($113) million in the year-ago quarter.
Customer service and merchant fees decreased 7.9% year over year to $139 million.
Advertising expenses fell 2.7% from the prior-year quarter’s level to $327 million. Selling, operations, technology, and general and administrative expenses decreased 0.3% year over year to $624 million.
Wayfair incurred an operating loss of $347 million in the reported quarter compared with an operating loss of $310 million in the year-ago quarter.
Balance Sheet & Cash Flow
As of Mar 31, 2023, cash, cash equivalents, and short-term investments were $1.05 billion, down from $1.28 billion as of Dec 31, 2022.
Long-term debt as of Mar 31, 2023, was $3.138 billion compared with $3.137 billion as of Dec 31, 2022.
In the first quarter, cash used in operations was $147 million against $98 million of cash generated from operations in the prior quarter.
Wayfair generated a negative free cash flow of $234 million.
Zacks Rank & Stocks to Consider
Currently, Wayfair has a Zacks Rank #3 (Hold).
Some better-ranked stocks in the retail-wholesale sector are The Kroger Co. KR, Ulta Beauty ULTA and Rush Enterprises RUSHA. All three companies currently carry a Zacks Rank #2 (Buy). You can see the complete list of today’s Zacks #1 Rank (Strong Buy) stocks here.
Kroger has gained 9.9% on a year-to-date basis. The long-term earnings growth rate for KR is projected at 5.99%.
Ulta Beauty has gained 10.4% on a year-to-date basis. The long-term earnings growth rate for ULTA is projected at 12.26%.
Rush Enterprises has lost 2.9% on a year-to-date basis. The long-term earnings growth rate for RUSHA is projected at 15%.
Want the latest recommendations from Zacks Investment Research? Today, you can download 7 Best Stocks for the Next 30 Days. Click to get this free report
The Kroger Co. (KR) : Free Stock Analysis Report
Ulta Beauty Inc. (ULTA) : Free Stock Analysis Report
Rush Enterprises, Inc. (RUSHA) : Free Stock Analysis Report
Wayfair Inc. (W) : Free Stock Analysis Report
