
 Yahoo Finance
 Should Weakness in The Berkeley Group Holdings plc's (LON:BKG) Stock Be Seen As A Sign That Market Will Correct The Share Price Given Decent Financials?
It is hard to get excited after looking at Berkeley Group Holdings' (LON:BKG) recent performance, when its stock has declined 8.0% over the past month. However, the company's fundamentals look pretty decent, and long-term financials are usually aligned with future market price movements. In this article, we decided to focus on Berkeley Group Holdings' ROE.
Return on equity or ROE is a key measure used to assess how efficiently a company's management is utilizing the company's capital. In short, ROE shows the profit each dollar generates with respect to its shareholder investments.
See our latest analysis for Berkeley Group Holdings
How Do You Calculate Return On Equity?
The formula for return on equity is:
Return on Equity = Net Profit (from continuing operations) ÷ Shareholders' Equity
So, based on the above formula, the ROE for Berkeley Group Holdings is:
15% = UK£482m ÷ UK£3.1b (Based on the trailing twelve months to April 2022).
The 'return' refers to a company's earnings over the last year. So, this means that for every £1 of its shareholder's investments, the company generates a profit of £0.15.
What Is The Relationship Between ROE And Earnings Growth?
So far, we've learned that ROE is a measure of a company's profitability. Depending on how much of these profits the company reinvests or "retains", and how effectively it does so, we are then able to assess a company’s earnings growth potential. Assuming everything else remains unchanged, the higher the ROE and profit retention, the higher the growth rate of a company compared to companies that don't necessarily bear these characteristics.
A Side By Side comparison of Berkeley Group Holdings' Earnings Growth And 15% ROE
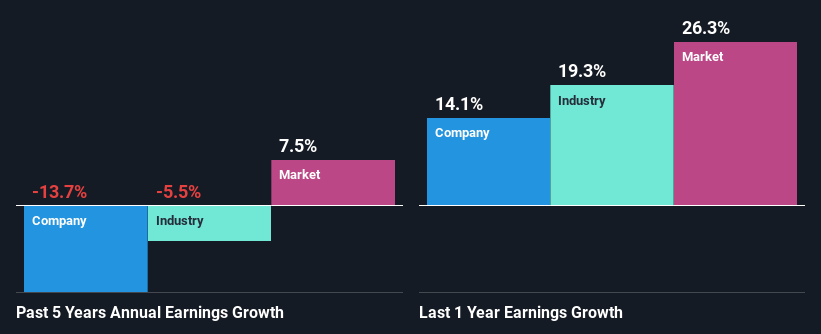
To start with, Berkeley Group Holdings' ROE looks acceptable. Further, the company's ROE compares quite favorably to the industry average of 12%. Needless to say, we are quite surprised to see that Berkeley Group Holdings' net income shrunk at a rate of 14% over the past five years. We reckon that there could be some other factors at play here that are preventing the company's growth. Such as, the company pays out a huge portion of its earnings as dividends, or is faced with competitive pressures.
Next, when we compared with the industry, which has shrunk its earnings at a rate of 5.5% in the same period, we still found Berkeley Group Holdings' performance to be quite bleak, because the company has been shrinking its earnings faster than the industry.
Earnings growth is an important metric to consider when valuing a stock. What investors need to determine next is if the expected earnings growth, or the lack of it, is already built into the share price. Doing so will help them establish if the stock's future looks promising or ominous. If you're wondering about Berkeley Group Holdings''s valuation, check out this gauge of its price-to-earnings ratio, as compared to its industry.
Is Berkeley Group Holdings Efficiently Re-investing Its Profits?
Berkeley Group Holdings' low three-year median payout ratio of 16% (or a retention ratio of 84%) over the last three years should mean that the company is retaining most of its earnings to fuel its growth but the company's earnings have actually shrunk. This typically shouldn't be the case when a company is retaining most of its earnings. So there might be other factors at play here which could potentially be hampering growth. For instance, the business has faced some headwinds.
Additionally, Berkeley Group Holdings has paid dividends over a period of at least ten years, which means that the company's management is determined to pay dividends even if it means little to no earnings growth. Looking at the current analyst consensus data, we can see that the company's future payout ratio is expected to rise to 56% over the next three years. Despite the higher expected payout ratio, the company's ROE is not expected to change by much.
Conclusion
Overall, we feel that Berkeley Group Holdings certainly does have some positive factors to consider. Yet, the low earnings growth is a bit concerning, especially given that the company has a high rate of return and is reinvesting ma huge portion of its profits. By the looks of it, there could be some other factors, not necessarily in control of the business, that's preventing growth. That being so, the latest industry analyst forecasts show that analysts are forecasting a slight improvement in the company's future earnings growth. The company's existing shareholders might have some respite after all. Are these analysts expectations based on the broad expectations for the industry, or on the company's fundamentals? Click here to be taken to our analyst's forecasts page for the company.
Have feedback on this article? Concerned about the content? Get in touch with us directly. Alternatively, email editorial-team (at) simplywallst.com.
This article by Simply Wall St is general in nature. We provide commentary based on historical data and analyst forecasts only using an unbiased methodology and our articles are not intended to be financial advice. It does not constitute a recommendation to buy or sell any stock, and does not take account of your objectives, or your financial situation. We aim to bring you long-term focused analysis driven by fundamental data. Note that our analysis may not factor in the latest price-sensitive company announcements or qualitative material. Simply Wall St has no position in any stocks mentioned.
Join A Paid User Research Session
You’ll receive a US$30 Amazon Gift card for 1 hour of your time while helping us build better investing tools for the individual investors like yourself. Sign up here
