
 Yahoo Finance
 Is Weakness In Goodman Group (ASX:GMG) Stock A Sign That The Market Could be Wrong Given Its Strong Financial Prospects?
It is hard to get excited after looking at Goodman Group's (ASX:GMG) recent performance, when its stock has declined 5.9% over the past three months. However, a closer look at its sound financials might cause you to think again. Given that fundamentals usually drive long-term market outcomes, the company is worth looking at. In this article, we decided to focus on Goodman Group's ROE.
Return on Equity or ROE is a test of how effectively a company is growing its value and managing investors’ money. In simpler terms, it measures the profitability of a company in relation to shareholder's equity.
Check out our latest analysis for Goodman Group
How Do You Calculate Return On Equity?
The formula for return on equity is:
Return on Equity = Net Profit (from continuing operations) ÷ Shareholders' Equity
So, based on the above formula, the ROE for Goodman Group is:
22% = AU$3.3b ÷ AU$15b (Based on the trailing twelve months to December 2021).
The 'return' is the income the business earned over the last year. That means that for every A$1 worth of shareholders' equity, the company generated A$0.22 in profit.
What Is The Relationship Between ROE And Earnings Growth?
So far, we've learned that ROE is a measure of a company's profitability. Depending on how much of these profits the company reinvests or "retains", and how effectively it does so, we are then able to assess a company’s earnings growth potential. Generally speaking, other things being equal, firms with a high return on equity and profit retention, have a higher growth rate than firms that don’t share these attributes.
Goodman Group's Earnings Growth And 22% ROE
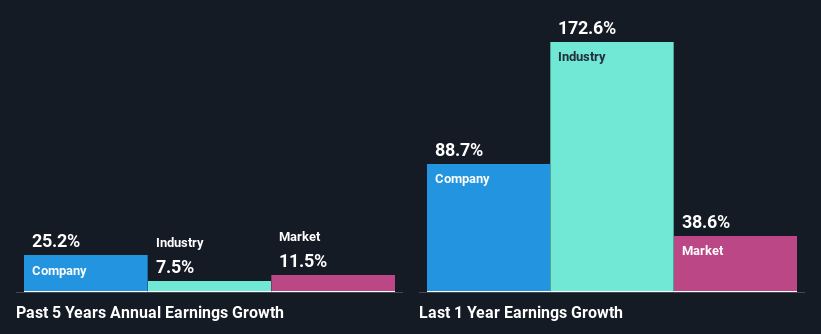
At first glance, Goodman Group seems to have a decent ROE. On comparing with the average industry ROE of 13% the company's ROE looks pretty remarkable. Probably as a result of this, Goodman Group was able to see an impressive net income growth of 25% over the last five years. However, there could also be other causes behind this growth. For example, it is possible that the company's management has made some good strategic decisions, or that the company has a low payout ratio.
We then compared Goodman Group's net income growth with the industry and we're pleased to see that the company's growth figure is higher when compared with the industry which has a growth rate of 7.5% in the same period.
The basis for attaching value to a company is, to a great extent, tied to its earnings growth. The investor should try to establish if the expected growth or decline in earnings, whichever the case may be, is priced in. This then helps them determine if the stock is placed for a bright or bleak future. What is GMG worth today? The intrinsic value infographic in our free research report helps visualize whether GMG is currently mispriced by the market.
Is Goodman Group Using Its Retained Earnings Effectively?
Goodman Group has a very high three-year median payout ratio of 55%. This means that it has only 45% of its income left to reinvest into its business. However, it's not unusual to see a REIT with such a high payout ratio mainly due to statutory requirements. Despite this, the company's earnings have grown significantly as we saw above.
Additionally, Goodman Group has paid dividends over a period of at least ten years which means that the company is pretty serious about sharing its profits with shareholders. Upon studying the latest analysts' consensus data, we found that the company's future payout ratio is expected to drop to 38% over the next three years. Still forecasts suggest that Goodman Group's future ROE will drop to 10% even though the the company's payout ratio is expected to decrease. This suggests that there could be other factors could driving the anticipated decline in the company's ROE.
Conclusion
On the whole, we feel that Goodman Group's performance has been quite good. We are particularly impressed by the considerable earnings growth posted by the company, which was likely backed by its high ROE. While the company is paying out most of its earnings as dividends, it has been able to grow its earnings in spite of it, so that's probably a good sign. With that said, the latest industry analyst forecasts reveal that the company's earnings growth is expected to slow down. Are these analysts expectations based on the broad expectations for the industry, or on the company's fundamentals? Click here to be taken to our analyst's forecasts page for the company.
Have feedback on this article? Concerned about the content? Get in touch with us directly. Alternatively, email editorial-team (at) simplywallst.com.
This article by Simply Wall St is general in nature. We provide commentary based on historical data and analyst forecasts only using an unbiased methodology and our articles are not intended to be financial advice. It does not constitute a recommendation to buy or sell any stock, and does not take account of your objectives, or your financial situation. We aim to bring you long-term focused analysis driven by fundamental data. Note that our analysis may not factor in the latest price-sensitive company announcements or qualitative material. Simply Wall St has no position in any stocks mentioned.
