
 Yahoo Finance
 Will Weakness in Science Group plc's (LON:SAG) Stock Prove Temporary Given Strong Fundamentals?
It is hard to get excited after looking at Science Group's (LON:SAG) recent performance, when its stock has declined 1.7% over the past week. However, a closer look at its sound financials might cause you to think again. Given that fundamentals usually drive long-term market outcomes, the company is worth looking at. Particularly, we will be paying attention to Science Group's ROE today.
Return on equity or ROE is a key measure used to assess how efficiently a company's management is utilizing the company's capital. Put another way, it reveals the company's success at turning shareholder investments into profits.
Check out our latest analysis for Science Group
How To Calculate Return On Equity?
The formula for return on equity is:
Return on Equity = Net Profit (from continuing operations) ÷ Shareholders' Equity
So, based on the above formula, the ROE for Science Group is:
22% = UK£9.7m ÷ UK£45m (Based on the trailing twelve months to June 2021).
The 'return' is the income the business earned over the last year. Another way to think of that is that for every £1 worth of equity, the company was able to earn £0.22 in profit.
What Has ROE Got To Do With Earnings Growth?
Thus far, we have learned that ROE measures how efficiently a company is generating its profits. We now need to evaluate how much profit the company reinvests or "retains" for future growth which then gives us an idea about the growth potential of the company. Assuming all else is equal, companies that have both a higher return on equity and higher profit retention are usually the ones that have a higher growth rate when compared to companies that don't have the same features.
A Side By Side comparison of Science Group's Earnings Growth And 22% ROE
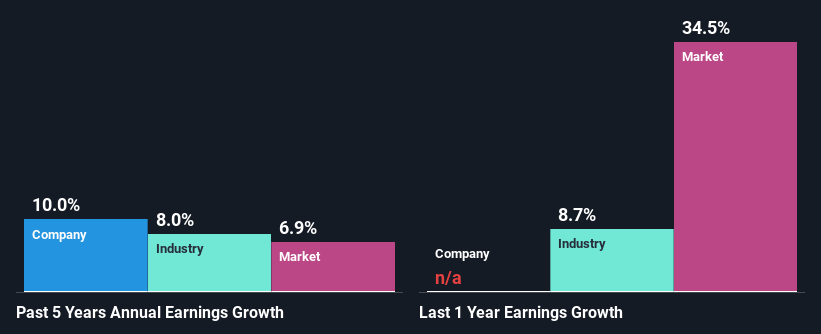
Firstly, we acknowledge that Science Group has a significantly high ROE. Additionally, the company's ROE is higher compared to the industry average of 10% which is quite remarkable. Probably as a result of this, Science Group was able to see a decent net income growth of 10.0% over the last five years.
As a next step, we compared Science Group's net income growth with the industry, and pleasingly, we found that the growth seen by the company is higher than the average industry growth of 8.0%.
Earnings growth is an important metric to consider when valuing a stock. It’s important for an investor to know whether the market has priced in the company's expected earnings growth (or decline). Doing so will help them establish if the stock's future looks promising or ominous. Is Science Group fairly valued compared to other companies? These 3 valuation measures might help you decide.
Is Science Group Efficiently Re-investing Its Profits?
Science Group has a three-year median payout ratio of 43%, which implies that it retains the remaining 57% of its profits. This suggests that its dividend is well covered, and given the decent growth seen by the company, it looks like management is reinvesting its earnings efficiently.
Moreover, Science Group is determined to keep sharing its profits with shareholders which we infer from its long history of nine years of paying a dividend. Existing analyst estimates suggest that the company's future payout ratio is expected to drop to 21% over the next three years.
Summary
On the whole, we feel that Science Group's performance has been quite good. In particular, it's great to see that the company is investing heavily into its business and along with a high rate of return, that has resulted in a sizeable growth in its earnings. If the company continues to grow its earnings the way it has, that could have a positive impact on its share price given how earnings per share influence long-term share prices. Remember, the price of a stock is also dependent on the perceived risk. Therefore investors must keep themselves informed about the risks involved before investing in any company. To know the 3 risks we have identified for Science Group visit our risks dashboard for free.
This article by Simply Wall St is general in nature. We provide commentary based on historical data and analyst forecasts only using an unbiased methodology and our articles are not intended to be financial advice. It does not constitute a recommendation to buy or sell any stock, and does not take account of your objectives, or your financial situation. We aim to bring you long-term focused analysis driven by fundamental data. Note that our analysis may not factor in the latest price-sensitive company announcements or qualitative material. Simply Wall St has no position in any stocks mentioned.
Have feedback on this article? Concerned about the content? Get in touch with us directly. Alternatively, email editorial-team (at) simplywallst.com.
