
 Yahoo Finance
 Will Weakness in Serco Group plc's (LON:SRP) Stock Prove Temporary Given Strong Fundamentals?
Serco Group (LON:SRP) has had a rough three months with its share price down 4.9%. However, a closer look at its sound financials might cause you to think again. Given that fundamentals usually drive long-term market outcomes, the company is worth looking at. Specifically, we decided to study Serco Group's ROE in this article.
Return on equity or ROE is an important factor to be considered by a shareholder because it tells them how effectively their capital is being reinvested. In simpler terms, it measures the profitability of a company in relation to shareholder's equity.
See our latest analysis for Serco Group
How Is ROE Calculated?
Return on equity can be calculated by using the formula:
Return on Equity = Net Profit (from continuing operations) ÷ Shareholders' Equity
So, based on the above formula, the ROE for Serco Group is:
20% = UK£202m ÷ UK£1.0b (Based on the trailing twelve months to December 2023).
The 'return' refers to a company's earnings over the last year. Another way to think of that is that for every £1 worth of equity, the company was able to earn £0.20 in profit.
What Is The Relationship Between ROE And Earnings Growth?
We have already established that ROE serves as an efficient profit-generating gauge for a company's future earnings. We now need to evaluate how much profit the company reinvests or "retains" for future growth which then gives us an idea about the growth potential of the company. Assuming everything else remains unchanged, the higher the ROE and profit retention, the higher the growth rate of a company compared to companies that don't necessarily bear these characteristics.
Serco Group's Earnings Growth And 20% ROE
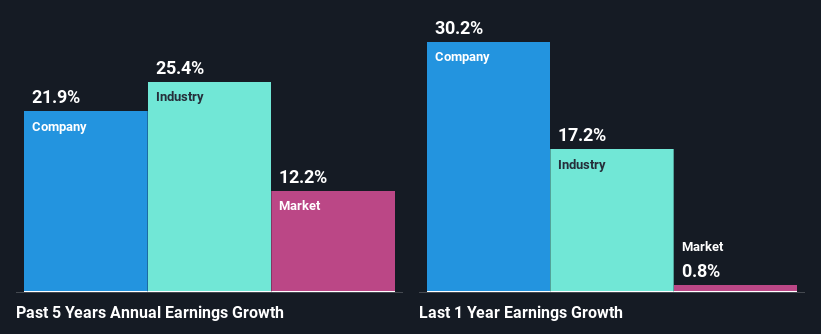
At first glance, Serco Group seems to have a decent ROE. Further, the company's ROE compares quite favorably to the industry average of 14%. This certainly adds some context to Serco Group's exceptional 22% net income growth seen over the past five years. We believe that there might also be other aspects that are positively influencing the company's earnings growth. For example, it is possible that the company's management has made some good strategic decisions, or that the company has a low payout ratio.
Next, on comparing Serco Group's net income growth with the industry, we found that the company's reported growth is similar to the industry average growth rate of 25% over the last few years.
Earnings growth is a huge factor in stock valuation. The investor should try to establish if the expected growth or decline in earnings, whichever the case may be, is priced in. By doing so, they will have an idea if the stock is headed into clear blue waters or if swampy waters await. What is SRP worth today? The intrinsic value infographic in our free research report helps visualize whether SRP is currently mispriced by the market.
Is Serco Group Using Its Retained Earnings Effectively?
Serco Group's three-year median payout ratio to shareholders is 17%, which is quite low. This implies that the company is retaining 83% of its profits. So it looks like Serco Group is reinvesting profits heavily to grow its business, which shows in its earnings growth.
Additionally, Serco Group has paid dividends over a period of at least ten years which means that the company is pretty serious about sharing its profits with shareholders. Looking at the current analyst consensus data, we can see that the company's future payout ratio is expected to rise to 30% over the next three years. Consequently, the higher expected payout ratio explains the decline in the company's expected ROE (to 15%) over the same period.
Summary
In total, we are pretty happy with Serco Group's performance. Particularly, we like that the company is reinvesting heavily into its business, and at a high rate of return. Unsurprisingly, this has led to an impressive earnings growth. Having said that, on studying current analyst estimates, we were concerned to see that while the company has grown its earnings in the past, analysts expect its earnings to shrink in the future. To know more about the latest analysts predictions for the company, check out this visualization of analyst forecasts for the company.
Have feedback on this article? Concerned about the content? Get in touch with us directly. Alternatively, email editorial-team (at) simplywallst.com.
This article by Simply Wall St is general in nature. We provide commentary based on historical data and analyst forecasts only using an unbiased methodology and our articles are not intended to be financial advice. It does not constitute a recommendation to buy or sell any stock, and does not take account of your objectives, or your financial situation. We aim to bring you long-term focused analysis driven by fundamental data. Note that our analysis may not factor in the latest price-sensitive company announcements or qualitative material. Simply Wall St has no position in any stocks mentioned.
