
 Yahoo Finance
 Was Webis Holdings plc's (LON:WEB) Earnings Decline Part Of A Broader Industry Downturn?

After looking at Webis Holdings plc's (AIM:WEB) latest earnings announcement (30 November 2019), I found it useful to revisit the company's performance in the past couple of years and assess this against the most recent figures. As a long-term investor I tend to focus on earnings trend, rather than a single number at one point in time. Also, comparing it against an industry benchmark to understand whether it outperformed, or is simply riding an industry wave, is a crucial aspect. Below is a brief commentary on my key takeaways.
View our latest analysis for Webis Holdings
Was WEB's weak performance lately a part of a long-term decline?
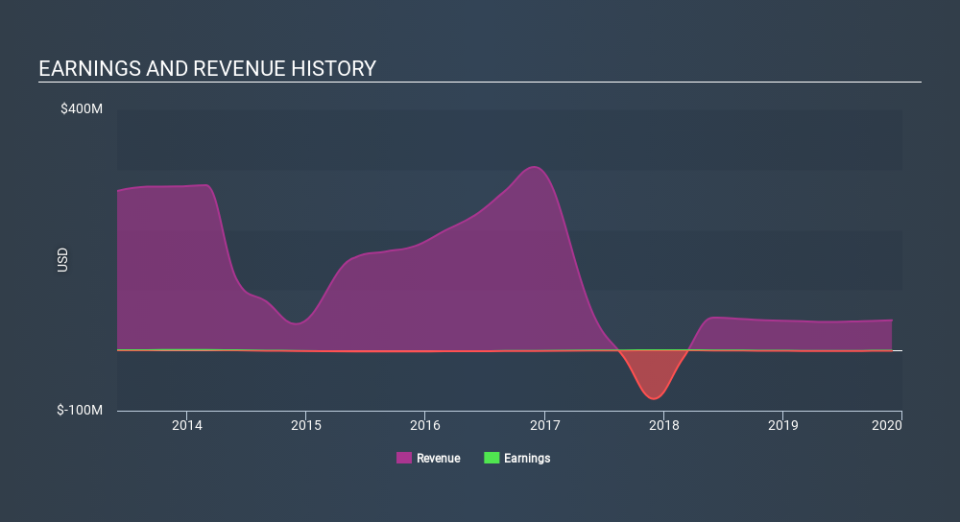
WEB is loss-making, with the most recent trailing twelve-month earnings of -US$546.0k (from 30 November 2019), which compared to last year has become more negative. Furthermore, the company's loss seem to be growing over time, with the five-year earnings average of -US$428.0k. Each year, for the past five years WEB has seen an annual decline in revenue of -32%, on average. This adverse movement is a driver of the company's inability to reach breakeven.
Looking at growth from a sector-level, the UK hospitality industry has been enduring some headwinds over the past year, leading to an average earnings drop of -11%. This is a momentous change, given that the industry has been delivering a positive rate of 9.1%, on average, over the past five years. This growth is a median of profitable companies of 25 Hospitality companies in GB including Daniel Thwaites, Playtech and Millennium & Copthorne Hotels. This means whatever near-term headwind the industry is facing, it’s hitting Webis Holdings harder than its peers.
Given that Webis Holdings is currently unprofitable, with operating expenses (opex) growing year-on-year at 4.2%, it may need to raise more cash over the next year. It currently has US$2.8m in cash and short-term investments, however, opex (SG&A and one-year R&D) reachedUS$5.2m in the latest twelve months. Even though this is analysis is fairly basic, and Webis Holdings still can cut its overhead in the near future, or open a new line of credit instead of issuing new equity shares, the analysis still gives us an idea of the company’s timeline and when things will have to start changing, since its current operation is unsustainable.
What does this mean?
While past data is useful, it doesn’t tell the whole story. Companies that incur net loss is always hard to forecast what will occur going forward, and when. The most useful step is to assess company-specific issues Webis Holdings may be facing and whether management guidance has steadily been met in the past. I recommend you continue to research Webis Holdings to get a more holistic view of the stock by looking at:
Financial Health: Are WEB’s operations financially sustainable? Balance sheets can be hard to analyze, which is why we’ve done it for you. Check out our financial health checks here.
Other High-Performing Stocks: Are there other stocks that provide better prospects with proven track records? Explore our free list of these great stocks here.
NB: Figures in this article are calculated using data from the trailing twelve months from 30 November 2019. This may not be consistent with full year annual report figures.
If you spot an error that warrants correction, please contact the editor at editorial-team@simplywallst.com. This article by Simply Wall St is general in nature. It does not constitute a recommendation to buy or sell any stock, and does not take account of your objectives, or your financial situation. Simply Wall St has no position in the stocks mentioned.
We aim to bring you long-term focused research analysis driven by fundamental data. Note that our analysis may not factor in the latest price-sensitive company announcements or qualitative material. Thank you for reading.
