
 Yahoo Finance
 Weir Group PLC's Dividend Analysis
Assessing the Upcoming Dividend and Historical Performance of Weir Group PLC
Weir Group PLC (WEGRY) recently announced a dividend of $0.13 per share, payable on 2024-06-07, with the ex-dividend date set for 2024-04-18. As investors look forward to this upcoming payment, the spotlight also shines on the company's dividend history, yield, and growth rates. Using the data from GuruFocus, let's look into Weir Group PLC's dividend performance and assess its sustainability.
What Does Weir Group PLC Do?
This Powerful Chart Made Peter Lynch 29% A Year For 13 Years
How to calculate the intrinsic value of a stock?
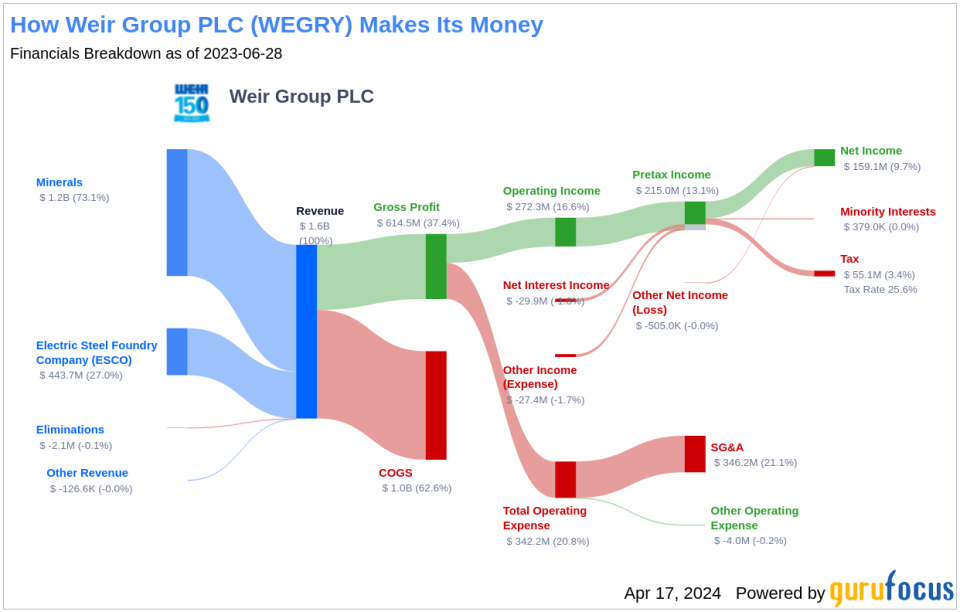
Weir Group PLC manufactures equipment for minerals and other industrial end markets. The company's operating segment includes Minerals and ESCO. The Minerals segment is into engineering, manufacturing and service processing technology used in abrasive, high-wear mining applications. It is also used in infrastructure and general industrial markets. The ESCO segment is into the provision of Ground Engaging Tools (G.E.T.) for large mining machines. It operates predominantly in mining and infrastructure markets where its technology improves productivity through extended wear life, increased safety and reduced energy consumption. The company generates maximum revenue from the Minerals segment. Geographically, the company derives a majority of its revenue from South America, U.S, and Canada.
A Glimpse at Weir Group PLC's Dividend History
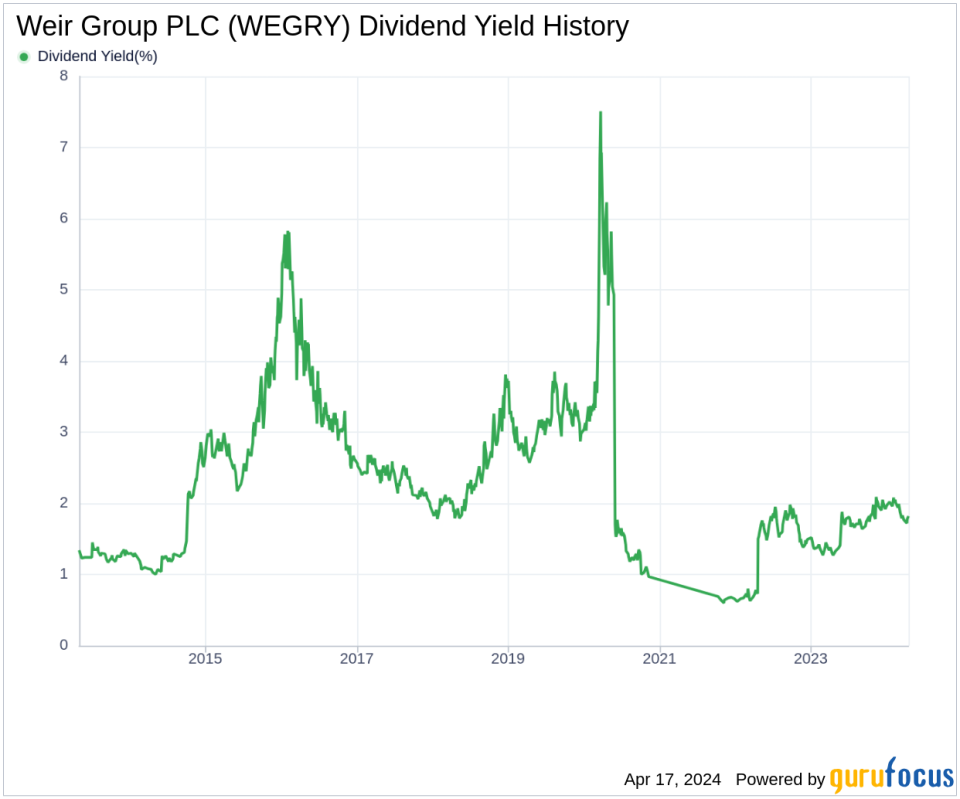
Weir Group PLC has maintained a consistent dividend payment record since 2021. Dividends are currently distributed on a bi-annual basis. Below is a chart showing annual Dividends Per Share for tracking historical trends.
Breaking Down Weir Group PLC's Dividend Yield and Growth
As of today, Weir Group PLC currently has a 12-month trailing dividend yield of 1.81% and a 12-month forward dividend yield of 1.91%. This suggests an expectation of increased dividend payments over the next 12 months. Additionally, based on Weir Group PLC's dividend yield and five-year growth rate, the 5-year yield on cost of Weir Group PLC stock as of today is approximately 1.81%.
The Sustainability Question: Payout Ratio and Profitability
To assess the sustainability of the dividend, one needs to evaluate the company's payout ratio. The dividend payout ratio provides insights into the portion of earnings the company distributes as dividends. A lower ratio suggests that the company retains a significant part of its earnings, thereby ensuring the availability of funds for future growth and unexpected downturns. As of 2023-12-31, Weir Group PLC's dividend payout ratio is 0.32. Weir Group PLC's profitability rank, offers an understanding of the company's earnings prowess relative to its peers. GuruFocus ranks Weir Group PLC's profitability 7 out of 10 as of 2023-12-31, suggesting good profitability prospects. The company has reported net profit in 7 years out of the past 10 years.
Growth Metrics: The Future Outlook
To ensure the sustainability of dividends, a company must have robust growth metrics. Weir Group PLC's growth rank of 7 out of 10 suggests that the company's growth trajectory is good relative to its competitors. Weir Group PLC's revenue per share, combined with the 3-year revenue growth rate, indicates a strong revenue model. The company's revenue has increased by approximately 10.60% per year on average, a rate that outperforms approximately 58.41% of global competitors. The company's 3-year EPS growth rate showcases its capability to grow its earnings, a critical component for sustaining dividends in the long run. During the past three years, Weir Group PLC's earnings increased by approximately 17.20% per year on average, a rate that outperforms approximately 56.96% of global competitors. Lastly, the company's 5-year EBITDA growth rate of 5.00%, which outperforms approximately 41.78% of global competitors.
Engaging Conclusion: Weighing the Dividend Prospects of Weir Group PLC
In conclusion, Weir Group PLC's upcoming dividend, consistent dividend history, and favorable yield and growth rates present an attractive profile for value investors. The company's prudent payout ratio and robust profitability rank underscore its ability to sustain and potentially grow dividends. Furthermore, Weir Group PLC's solid growth metrics paint a promising picture for future financial performance, which is essential for maintaining a healthy dividend stream. Investors in search of dividend-paying stocks may find Weir Group PLC an interesting candidate, especially when considering the company's strategic position in the industrial equipment sector. Will Weir Group PLC continue to be a reliable source of dividends for value-focused portfolios? Only time will tell, but the current indicators offer a positive outlook. For further dividend stock exploration, GuruFocus Premium users can utilize the High Dividend Yield Screener to discover more high-yielding investment opportunities.
This article, generated by GuruFocus, is designed to provide general insights and is not tailored financial advice. Our commentary is rooted in historical data and analyst projections, utilizing an impartial methodology, and is not intended to serve as specific investment guidance. It does not formulate a recommendation to purchase or divest any stock and does not consider individual investment objectives or financial circumstances. Our objective is to deliver long-term, fundamental data-driven analysis. Be aware that our analysis might not incorporate the most recent, price-sensitive company announcements or qualitative information. GuruFocus holds no position in the stocks mentioned herein.
This article first appeared on GuruFocus.
