
 Yahoo Finance
 Wells Fargo's (NYSE:WFC) investors will be pleased with their notable 72% return over the last year
If you want to compound wealth in the stock market, you can do so by buying an index fund. But one can do better than that by picking better than average stocks (as part of a diversified portfolio). To wit, the Wells Fargo & Company (NYSE:WFC) share price is 70% higher than it was a year ago, much better than the market return of around 21% (not including dividends) in the same period. So that should have shareholders smiling. In contrast, the longer term returns are negative, since the share price is 11% lower than it was three years ago.
So let's assess the underlying fundamentals over the last 1 year and see if they've moved in lock-step with shareholder returns.
View our latest analysis for Wells Fargo
While the efficient markets hypothesis continues to be taught by some, it has been proven that markets are over-reactive dynamic systems, and investors are not always rational. One flawed but reasonable way to assess how sentiment around a company has changed is to compare the earnings per share (EPS) with the share price.
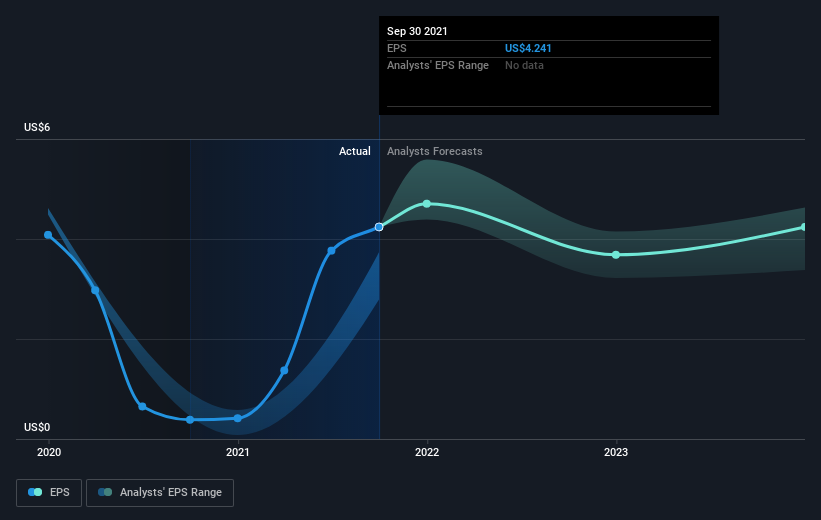
During the last year Wells Fargo saw its earnings per share (EPS) increase strongly. This remarkable growth rate may not be sustainable, but it is still impressive. So we'd expect to see the share price higher. We're real advocates of letting inflection points like this guide our research as stock pickers.
You can see how EPS has changed over time in the image below (click on the chart to see the exact values).
We know that Wells Fargo has improved its bottom line lately, but is it going to grow revenue? Check if analysts think Wells Fargo will grow revenue in the future.
What About Dividends?
When looking at investment returns, it is important to consider the difference between total shareholder return (TSR) and share price return. Whereas the share price return only reflects the change in the share price, the TSR includes the value of dividends (assuming they were reinvested) and the benefit of any discounted capital raising or spin-off. It's fair to say that the TSR gives a more complete picture for stocks that pay a dividend. As it happens, Wells Fargo's TSR for the last 1 year was 72%, which exceeds the share price return mentioned earlier. This is largely a result of its dividend payments!
A Different Perspective
We're pleased to report that Wells Fargo shareholders have received a total shareholder return of 72% over one year. And that does include the dividend. That gain is better than the annual TSR over five years, which is 1.0%. Therefore it seems like sentiment around the company has been positive lately. Someone with an optimistic perspective could view the recent improvement in TSR as indicating that the business itself is getting better with time. It's always interesting to track share price performance over the longer term. But to understand Wells Fargo better, we need to consider many other factors. Case in point: We've spotted 1 warning sign for Wells Fargo you should be aware of.
Of course Wells Fargo may not be the best stock to buy. So you may wish to see this free collection of growth stocks.
Please note, the market returns quoted in this article reflect the market weighted average returns of stocks that currently trade on US exchanges.
This article by Simply Wall St is general in nature. We provide commentary based on historical data and analyst forecasts only using an unbiased methodology and our articles are not intended to be financial advice. It does not constitute a recommendation to buy or sell any stock, and does not take account of your objectives, or your financial situation. We aim to bring you long-term focused analysis driven by fundamental data. Note that our analysis may not factor in the latest price-sensitive company announcements or qualitative material. Simply Wall St has no position in any stocks mentioned.
Have feedback on this article? Concerned about the content? Get in touch with us directly. Alternatively, email editorial-team (at) simplywallst.com.
