
 Yahoo Finance
 Wentworth Resources (LON:WEN) shareholders have earned a 29% return over the last year
If you want to compound wealth in the stock market, you can do so by buying an index fund. But one can do better than that by picking better than average stocks (as part of a diversified portfolio). For example, the Wentworth Resources plc (LON:WEN) share price is up 22% in the last 1 year, clearly besting the market return of around 9.8% (not including dividends). If it can keep that out-performance up over the long term, investors will do very well! Zooming out, the stock is actually down 5.9% in the last three years.
With that in mind, it's worth seeing if the company's underlying fundamentals have been the driver of long term performance, or if there are some discrepancies.
See our latest analysis for Wentworth Resources
To paraphrase Benjamin Graham: Over the short term the market is a voting machine, but over the long term it's a weighing machine. One way to examine how market sentiment has changed over time is to look at the interaction between a company's share price and its earnings per share (EPS).
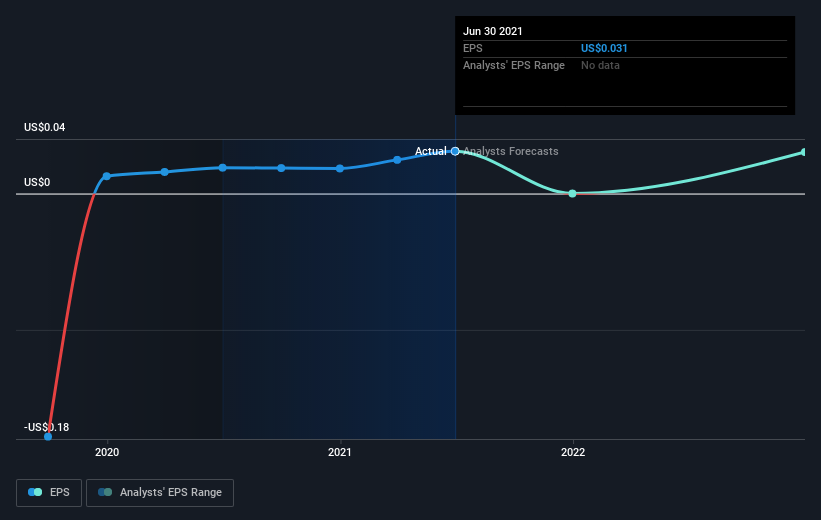
During the last year Wentworth Resources grew its earnings per share (EPS) by 64%. It's fair to say that the share price gain of 22% did not keep pace with the EPS growth. So it seems like the market has cooled on Wentworth Resources, despite the growth. Interesting. The caution is also evident in the lowish P/E ratio of 8.86.
The graphic below depicts how EPS has changed over time (unveil the exact values by clicking on the image).
We know that Wentworth Resources has improved its bottom line over the last three years, but what does the future have in store? Take a more thorough look at Wentworth Resources' financial health with this free report on its balance sheet.
What About Dividends?
When looking at investment returns, it is important to consider the difference between total shareholder return (TSR) and share price return. The TSR incorporates the value of any spin-offs or discounted capital raisings, along with any dividends, based on the assumption that the dividends are reinvested. Arguably, the TSR gives a more comprehensive picture of the return generated by a stock. In the case of Wentworth Resources, it has a TSR of 29% for the last 1 year. That exceeds its share price return that we previously mentioned. And there's no prize for guessing that the dividend payments largely explain the divergence!
A Different Perspective
Pleasingly, Wentworth Resources' total shareholder return last year was 29%. That's including the dividend. So this year's TSR was actually better than the three-year TSR (annualized) of 4%. The improving returns to shareholders suggests the stock is becoming more popular with time. I find it very interesting to look at share price over the long term as a proxy for business performance. But to truly gain insight, we need to consider other information, too. Consider for instance, the ever-present spectre of investment risk. We've identified 2 warning signs with Wentworth Resources , and understanding them should be part of your investment process.
We will like Wentworth Resources better if we see some big insider buys. While we wait, check out this free list of growing companies with considerable, recent, insider buying.
Please note, the market returns quoted in this article reflect the market weighted average returns of stocks that currently trade on GB exchanges.
Have feedback on this article? Concerned about the content? Get in touch with us directly. Alternatively, email editorial-team (at) simplywallst.com.
This article by Simply Wall St is general in nature. We provide commentary based on historical data and analyst forecasts only using an unbiased methodology and our articles are not intended to be financial advice. It does not constitute a recommendation to buy or sell any stock, and does not take account of your objectives, or your financial situation. We aim to bring you long-term focused analysis driven by fundamental data. Note that our analysis may not factor in the latest price-sensitive company announcements or qualitative material. Simply Wall St has no position in any stocks mentioned.
