
 Yahoo Finance
 We're Hopeful That Oxford BioDynamics (LON:OBD) Will Use Its Cash Wisely
We can readily understand why investors are attracted to unprofitable companies. For example, although Amazon.com made losses for many years after listing, if you had bought and held the shares since 1999, you would have made a fortune. But the harsh reality is that very many loss making companies burn through all their cash and go bankrupt.
So should Oxford BioDynamics (LON:OBD) shareholders be worried about its cash burn? In this report, we will consider the company's annual negative free cash flow, henceforth referring to it as the 'cash burn'. The first step is to compare its cash burn with its cash reserves, to give us its 'cash runway'.
Check out our latest analysis for Oxford BioDynamics
How Long Is Oxford BioDynamics' Cash Runway?
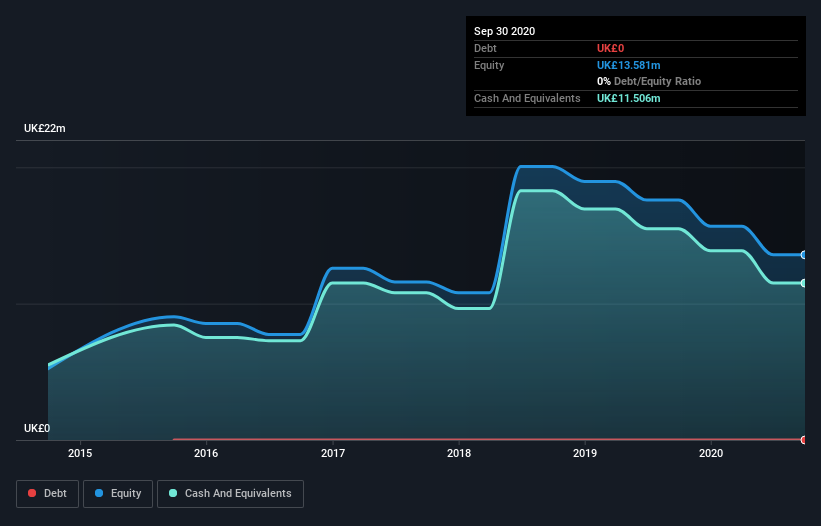
A company's cash runway is the amount of time it would take to burn through its cash reserves at its current cash burn rate. In September 2020, Oxford BioDynamics had UK£12m in cash, and was debt-free. Looking at the last year, the company burnt through UK£3.9m. So it had a cash runway of about 3.0 years from September 2020. That's decent, giving the company a couple years to develop its business. Depicted below, you can see how its cash holdings have changed over time.
How Is Oxford BioDynamics' Cash Burn Changing Over Time?
In the last year, Oxford BioDynamics did book revenue of UK£456k, but its revenue from operations was less, at just UK£456k. Given how low that operating leverage is, we think it's too early to put much weight on the revenue growth, so we'll focus on how the cash burn is changing, instead. Over the last year its cash burn actually increased by 33%, which suggests that management are increasing investment in future growth, but not too quickly. That's not necessarily a bad thing, but investors should be mindful of the fact that will shorten the cash runway. Oxford BioDynamics makes us a little nervous due to its lack of substantial operating revenue. We prefer most of the stocks on this list of stocks that analysts expect to grow.
How Hard Would It Be For Oxford BioDynamics To Raise More Cash For Growth?
Given its cash burn trajectory, Oxford BioDynamics shareholders may wish to consider how easily it could raise more cash, despite its solid cash runway. Issuing new shares, or taking on debt, are the most common ways for a listed company to raise more money for its business. Commonly, a business will sell new shares in itself to raise cash and drive growth. By comparing a company's annual cash burn to its total market capitalisation, we can estimate roughly how many shares it would have to issue in order to run the company for another year (at the same burn rate).
Since it has a market capitalisation of UK£56m, Oxford BioDynamics' UK£3.9m in cash burn equates to about 6.8% of its market value. That's a low proportion, so we figure the company would be able to raise more cash to fund growth, with a little dilution, or even to simply borrow some money.
Is Oxford BioDynamics' Cash Burn A Worry?
It may already be apparent to you that we're relatively comfortable with the way Oxford BioDynamics is burning through its cash. In particular, we think its cash runway stands out as evidence that the company is well on top of its spending. While its increasing cash burn wasn't great, the other factors mentioned in this article more than make up for weakness on that measure. Looking at all the measures in this article, together, we're not worried about its rate of cash burn; the company seems well on top of its medium-term spending needs. Taking a deeper dive, we've spotted 4 warning signs for Oxford BioDynamics you should be aware of, and 2 of them make us uncomfortable.
Of course Oxford BioDynamics may not be the best stock to buy. So you may wish to see this free collection of companies boasting high return on equity, or this list of stocks that insiders are buying.
This article by Simply Wall St is general in nature. It does not constitute a recommendation to buy or sell any stock, and does not take account of your objectives, or your financial situation. We aim to bring you long-term focused analysis driven by fundamental data. Note that our analysis may not factor in the latest price-sensitive company announcements or qualitative material. Simply Wall St has no position in any stocks mentioned.
Have feedback on this article? Concerned about the content? Get in touch with us directly. Alternatively, email editorial-team (at) simplywallst.com.
