
 Yahoo Finance
 We're Interested To See How ActiveOps (LON:AOM) Uses Its Cash Hoard To Grow
We can readily understand why investors are attracted to unprofitable companies. For example, although software-as-a-service business Salesforce.com lost money for years while it grew recurring revenue, if you held shares since 2005, you'd have done very well indeed. But while the successes are well known, investors should not ignore the very many unprofitable companies that simply burn through all their cash and collapse.
So should ActiveOps (LON:AOM) shareholders be worried about its cash burn? For the purposes of this article, cash burn is the annual rate at which an unprofitable company spends cash to fund its growth; its negative free cash flow. We'll start by comparing its cash burn with its cash reserves in order to calculate its cash runway.
View our latest analysis for ActiveOps
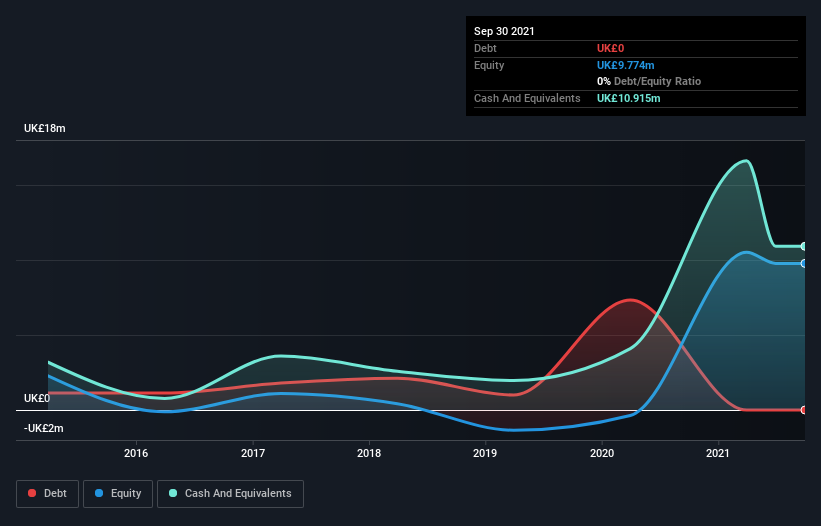
Does ActiveOps Have A Long Cash Runway?
You can calculate a company's cash runway by dividing the amount of cash it has by the rate at which it is spending that cash. As at September 2021, ActiveOps had cash of UK£11m and no debt. Looking at the last year, the company burnt through UK£733k. That means it had a cash runway of very many years as of September 2021. While this is only one measure of its cash burn situation, it certainly gives us the impression that holders have nothing to worry about. Depicted below, you can see how its cash holdings have changed over time.
Is ActiveOps' Revenue Growing?
Given that ActiveOps actually had positive free cash flow last year, before burning cash this year, we'll focus on its operating revenue to get a measure of the business trajectory. While it's not that amazing, we still think that the 10.0% increase in revenue from operations was a positive. While the past is always worth studying, it is the future that matters most of all. For that reason, it makes a lot of sense to take a look at our analyst forecasts for the company.
Can ActiveOps Raise More Cash Easily?
While ActiveOps is showing solid revenue growth, it's still worth considering how easily it could raise more cash, even just to fuel faster growth. Companies can raise capital through either debt or equity. Many companies end up issuing new shares to fund future growth. By comparing a company's annual cash burn to its total market capitalisation, we can estimate roughly how many shares it would have to issue in order to run the company for another year (at the same burn rate).
ActiveOps has a market capitalisation of UK£130m and burnt through UK£733k last year, which is 0.6% of the company's market value. So it could almost certainly just borrow a little to fund another year's growth, or else easily raise the cash by issuing a few shares.
So, Should We Worry About ActiveOps' Cash Burn?
It may already be apparent to you that we're relatively comfortable with the way ActiveOps is burning through its cash. In particular, we think its cash runway stands out as evidence that the company is well on top of its spending. Its weak point is its revenue growth, but even that wasn't too bad! Taking all the factors in this report into account, we're not at all worried about its cash burn, as the business appears well capitalized to spend as needs be. On another note, ActiveOps has 2 warning signs (and 1 which is a bit concerning) we think you should know about.
Of course ActiveOps may not be the best stock to buy. So you may wish to see this free collection of companies boasting high return on equity, or this list of stocks that insiders are buying.
This article by Simply Wall St is general in nature. We provide commentary based on historical data and analyst forecasts only using an unbiased methodology and our articles are not intended to be financial advice. It does not constitute a recommendation to buy or sell any stock, and does not take account of your objectives, or your financial situation. We aim to bring you long-term focused analysis driven by fundamental data. Note that our analysis may not factor in the latest price-sensitive company announcements or qualitative material. Simply Wall St has no position in any stocks mentioned.
Have feedback on this article? Concerned about the content? Get in touch with us directly. Alternatively, email editorial-team (at) simplywallst.com.
