
 Yahoo Finance
 We're Keeping An Eye On Polarean Imaging's (LON:POLX) Cash Burn Rate
Even when a business is losing money, it's possible for shareholders to make money if they buy a good business at the right price. For example, biotech and mining exploration companies often lose money for years before finding success with a new treatment or mineral discovery. Nonetheless, only a fool would ignore the risk that a loss making company burns through its cash too quickly.
So should Polarean Imaging (LON:POLX) shareholders be worried about its cash burn? In this report, we will consider the company's annual negative free cash flow, henceforth referring to it as the 'cash burn'. The first step is to compare its cash burn with its cash reserves, to give us its 'cash runway'.
Check out our latest analysis for Polarean Imaging
Does Polarean Imaging Have A Long Cash Runway?
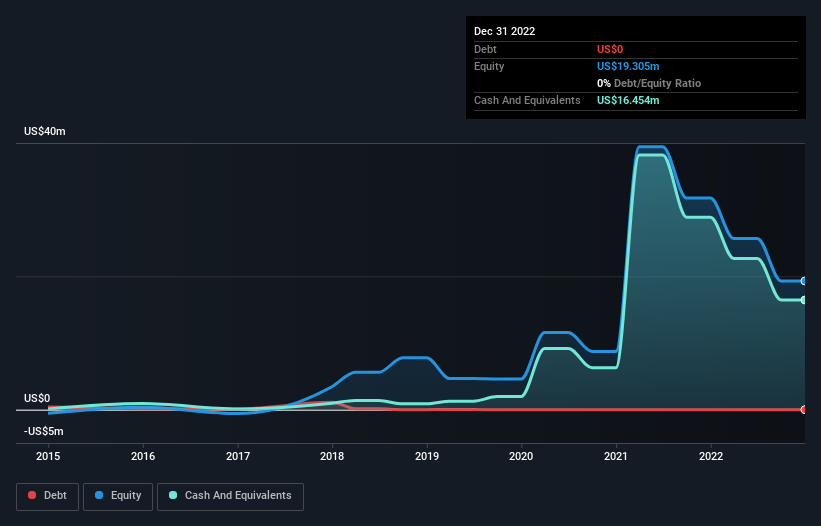
You can calculate a company's cash runway by dividing the amount of cash it has by the rate at which it is spending that cash. As at December 2022, Polarean Imaging had cash of US$16m and no debt. In the last year, its cash burn was US$12m. Therefore, from December 2022 it had roughly 16 months of cash runway. While that cash runway isn't too concerning, sensible holders would be peering into the distance, and considering what happens if the company runs out of cash. The image below shows how its cash balance has been changing over the last few years.
How Well Is Polarean Imaging Growing?
Polarean Imaging reduced its cash burn by 3.7% during the last year, which points to some degree of discipline. Unfortunately, however, operating revenue declined by 13% during the period. Considering both these factors, we're not particularly excited by its growth profile. Clearly, however, the crucial factor is whether the company will grow its business going forward. So you might want to take a peek at how much the company is expected to grow in the next few years.
Can Polarean Imaging Raise More Cash Easily?
Even though it seems like Polarean Imaging is developing its business nicely, we still like to consider how easily it could raise more money to accelerate growth. Generally speaking, a listed business can raise new cash through issuing shares or taking on debt. Commonly, a business will sell new shares in itself to raise cash and drive growth. By looking at a company's cash burn relative to its market capitalisation, we gain insight on how much shareholders would be diluted if the company needed to raise enough cash to cover another year's cash burn.
Polarean Imaging's cash burn of US$12m is about 19% of its US$64m market capitalisation. As a result, we'd venture that the company could raise more cash for growth without much trouble, albeit at the cost of some dilution.
Is Polarean Imaging's Cash Burn A Worry?
Even though its falling revenue makes us a little nervous, we are compelled to mention that we thought Polarean Imaging's cash runway was relatively promising. We don't think its cash burn is particularly problematic, but after considering the range of factors in this article, we do think shareholders should be monitoring how it changes over time. On another note, Polarean Imaging has 4 warning signs (and 1 which makes us a bit uncomfortable) we think you should know about.
Of course Polarean Imaging may not be the best stock to buy. So you may wish to see this free collection of companies boasting high return on equity, or this list of stocks that insiders are buying.
Have feedback on this article? Concerned about the content? Get in touch with us directly. Alternatively, email editorial-team (at) simplywallst.com.
This article by Simply Wall St is general in nature. We provide commentary based on historical data and analyst forecasts only using an unbiased methodology and our articles are not intended to be financial advice. It does not constitute a recommendation to buy or sell any stock, and does not take account of your objectives, or your financial situation. We aim to bring you long-term focused analysis driven by fundamental data. Note that our analysis may not factor in the latest price-sensitive company announcements or qualitative material. Simply Wall St has no position in any stocks mentioned.
Join A Paid User Research Session
You’ll receive a US$30 Amazon Gift card for 1 hour of your time while helping us build better investing tools for the individual investors like yourself. Sign up here
