
 Yahoo Finance
 We're Watching These Trends At Triple-S Management (NYSE:GTS)

To find a multi-bagger stock, what are the underlying trends we should look for in a business? Firstly, we'll want to see a proven return on capital employed (ROCE) that is increasing, and secondly, an expanding base of capital employed. This shows us that it's a compounding machine, able to continually reinvest its earnings back into the business and generate higher returns. However, after briefly looking over the numbers, we don't think Triple-S Management (NYSE:GTS) has the makings of a multi-bagger going forward, but let's have a look at why that may be.
Understanding Return On Capital Employed (ROCE)
If you haven't worked with ROCE before, it measures the 'return' (pre-tax profit) a company generates from capital employed in its business. Analysts use this formula to calculate it for Triple-S Management:
Return on Capital Employed = Earnings Before Interest and Tax (EBIT) ÷ (Total Assets - Current Liabilities)
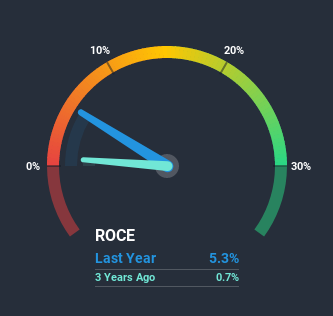
0.053 = US$79m ÷ (US$3.0b - US$1.5b) (Based on the trailing twelve months to June 2020).
So, Triple-S Management has an ROCE of 5.3%. In absolute terms, that's a low return and it also under-performs the Healthcare industry average of 9.8%.
View our latest analysis for Triple-S Management
While the past is not representative of the future, it can be helpful to know how a company has performed historically, which is why we have this chart above. If you'd like to look at how Triple-S Management has performed in the past in other metrics, you can view this free graph of past earnings, revenue and cash flow.
So How Is Triple-S Management's ROCE Trending?
There hasn't been much to report for Triple-S Management's returns and its level of capital employed because both metrics have been steady for the past five years. Businesses with these traits tend to be mature and steady operations because they're past the growth phase. With that in mind, unless investment picks up again in the future, we wouldn't expect Triple-S Management to be a multi-bagger going forward.
On another note, while the change in ROCE trend might not scream for attention, it's interesting that the current liabilities have actually gone up over the last five years. This is intriguing because if current liabilities hadn't increased to 51% of total assets, this reported ROCE would probably be less than5.3% because total capital employed would be higher.The 5.3% ROCE could be even lower if current liabilities weren't 51% of total assets, because the the formula would show a larger base of total capital employed. So with current liabilities at such high levels, this effectively means the likes of suppliers or short-term creditors are funding a meaningful part of the business, which in some instances can bring some risks.
Our Take On Triple-S Management's ROCE
We can conclude that in regards to Triple-S Management's returns on capital employed and the trends, there isn't much change to report on. Unsurprisingly then, the total return to shareholders over the last five years has been flat. On the whole, we aren't too inspired by the underlying trends and we think there may be better chances of finding a multi-bagger elsewhere.
On a final note, we've found 1 warning sign for Triple-S Management that we think you should be aware of.
While Triple-S Management isn't earning the highest return, check out this free list of companies that are earning high returns on equity with solid balance sheets.
This article by Simply Wall St is general in nature. It does not constitute a recommendation to buy or sell any stock, and does not take account of your objectives, or your financial situation. We aim to bring you long-term focused analysis driven by fundamental data. Note that our analysis may not factor in the latest price-sensitive company announcements or qualitative material. Simply Wall St has no position in any stocks mentioned.
Have feedback on this article? Concerned about the content? Get in touch with us directly. Alternatively, email editorial-team@simplywallst.com.
