
 Yahoo Finance
 Westminster Group PLC's (LON:WSG) Prospects Need A Boost To Lift Shares
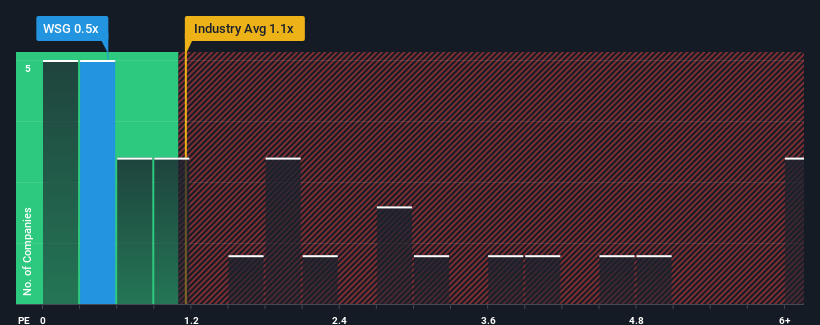
When close to half the companies operating in the Electronic industry in the United Kingdom have price-to-sales ratios (or "P/S") above 1.1x, you may consider Westminster Group PLC (LON:WSG) as an attractive investment with its 0.5x P/S ratio. Nonetheless, we'd need to dig a little deeper to determine if there is a rational basis for the reduced P/S.
See our latest analysis for Westminster Group
What Does Westminster Group's Recent Performance Look Like?
With revenue growth that's exceedingly strong of late, Westminster Group has been doing very well. One possibility is that the P/S ratio is low because investors think this strong revenue growth might actually underperform the broader industry in the near future. If you like the company, you'd be hoping this isn't the case so that you could potentially pick up some stock while it's out of favour.
Want the full picture on earnings, revenue and cash flow for the company? Then our free report on Westminster Group will help you shine a light on its historical performance.
Do Revenue Forecasts Match The Low P/S Ratio?
In order to justify its P/S ratio, Westminster Group would need to produce sluggish growth that's trailing the industry.
Taking a look back first, we see that the company grew revenue by an impressive 35% last year. Still, revenue has fallen 12% in total from three years ago, which is quite disappointing. Accordingly, shareholders would have felt downbeat about the medium-term rates of revenue growth.
Weighing that medium-term revenue trajectory against the broader industry's one-year forecast for expansion of 5.6% shows it's an unpleasant look.
With this information, we are not surprised that Westminster Group is trading at a P/S lower than the industry. However, we think shrinking revenues are unlikely to lead to a stable P/S over the longer term, which could set up shareholders for future disappointment. Even just maintaining these prices could be difficult to achieve as recent revenue trends are already weighing down the shares.
The Final Word
It's argued the price-to-sales ratio is an inferior measure of value within certain industries, but it can be a powerful business sentiment indicator.
Our examination of Westminster Group confirms that the company's shrinking revenue over the past medium-term is a key factor in its low price-to-sales ratio, given the industry is projected to grow. At this stage investors feel the potential for an improvement in revenue isn't great enough to justify a higher P/S ratio. If recent medium-term revenue trends continue, it's hard to see the share price moving strongly in either direction in the near future under these circumstances.
You always need to take note of risks, for example - Westminster Group has 2 warning signs we think you should be aware of.
If strong companies turning a profit tickle your fancy, then you'll want to check out this free list of interesting companies that trade on a low P/E (but have proven they can grow earnings).
Have feedback on this article? Concerned about the content? Get in touch with us directly. Alternatively, email editorial-team (at) simplywallst.com.
This article by Simply Wall St is general in nature. We provide commentary based on historical data and analyst forecasts only using an unbiased methodology and our articles are not intended to be financial advice. It does not constitute a recommendation to buy or sell any stock, and does not take account of your objectives, or your financial situation. We aim to bring you long-term focused analysis driven by fundamental data. Note that our analysis may not factor in the latest price-sensitive company announcements or qualitative material. Simply Wall St has no position in any stocks mentioned.
