
 Yahoo Finance
 Where AIA Group Limited (HKG:1299) Stands In Terms Of Earnings Growth Against Its Industry

Examining how AIA Group Limited (HKG:1299) is performing as a company requires looking at more than just a years’ earnings. Below, I will run you through a simple sense check to build perspective on how AIA Group is doing by comparing its most recent earnings with its historical trend, in addition to the performance of its insurance industry peers.
Check out our latest analysis for AIA Group
Did 1299 beat its long-term earnings growth trend and its industry?
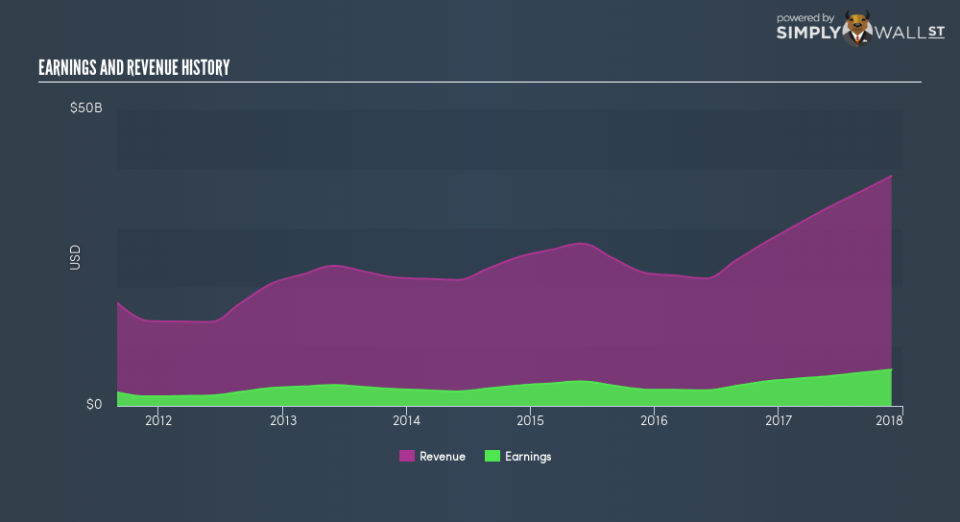
1299’s trailing twelve-month earnings (from 30 November 2017) of US$6.12b has jumped 47.0% compared to the previous year. Furthermore, this one-year growth rate has exceeded its 5-year annual growth average of 14.3%, indicating the rate at which 1299 is growing has accelerated. What’s the driver of this growth? Well, let’s take a look at if it is only a result of industry tailwinds, or if AIA Group has experienced some company-specific growth.
Over the past couple of years, AIA Group increased its bottom line faster than revenue by effectively controlling its costs. This resulted in a margin expansion and profitability over time. Looking at growth from a sector-level, the HK insurance industry has been growing its average earnings by double-digit 28.0% over the prior twelve months, and 13.2% over the past five years. This growth is a median of profitable companies of 11 Insurance companies in HK including Manulife Financial, Prudential and China Reinsurance (Group). This suggests that any tailwind the industry is deriving benefit from, AIA Group is able to amplify this to its advantage.
In terms of returns from investment, AIA Group has fallen short of achieving a 20% return on equity (ROE), recording 14.6% instead. However, its return on assets (ROA) of 2.9% exceeds the HK Insurance industry of 1.8%, indicating AIA Group has used its assets more efficiently. And finally, its return on capital (ROC), which also accounts for AIA Group’s debt level, has increased over the past 3 years from 3.0% to 3.7%.
What does this mean?
Though AIA Group’s past data is helpful, it is only one aspect of my investment thesis. Companies that have performed well in the past, such as AIA Group gives investors conviction. However, the next step would be to assess whether the future looks as optimistic. You should continue to research AIA Group to get a better picture of the stock by looking at:
Future Outlook: What are well-informed industry analysts predicting for 1299’s future growth? Take a look at our free research report of analyst consensus for 1299’s outlook.
Financial Health: Are 1299’s operations financially sustainable? Balance sheets can be hard to analyze, which is why we’ve done it for you. Check out our financial health checks here.
Other High-Performing Stocks: Are there other stocks that provide better prospects with proven track records? Explore our free list of these great stocks here.
NB: Figures in this article are calculated using data from the trailing twelve months from 30 November 2017. This may not be consistent with full year annual report figures.
To help readers see past the short term volatility of the financial market, we aim to bring you a long-term focused research analysis purely driven by fundamental data. Note that our analysis does not factor in the latest price-sensitive company announcements.
The author is an independent contributor and at the time of publication had no position in the stocks mentioned. For errors that warrant correction please contact the editor at editorial-team@simplywallst.com.
