
 Yahoo Finance
 Where Funcom NV.’s (OB:FUNCOM) Earnings Growth Stands Against Its Industry

For investors with a long-term horizon, assessing earnings trend over time and against industry benchmarks is more valuable than looking at a single earnings announcement in one point in time. Investors may find my commentary, albeit very high-level and brief, on Funcom NV. (OB:FUNCOM) useful as an attempt to give more color around how Funcom is currently performing. See our latest analysis for Funcom
Despite a decline, did FUNCOM underperform the long-term trend and the industry?
I look at the ‘latest twelve-month’ data, which either annualizes the most recent 6-month earnings update, or in some cases, the most recent annual report is already the latest available financial data. This blend enables me to analyze many different companies on a similar basis, using the latest information. For Funcom, its most recent earnings (trailing twelve month) is -US$2.34M, which, in comparison to the prior year’s figure, has turned from positive to negative. Since these values may be fairly short-term thinking, I’ve determined an annualized five-year figure for Funcom’s net income, which stands at -US$13.31M. This suggests that, although net income is negative, it has become less negative over the years.
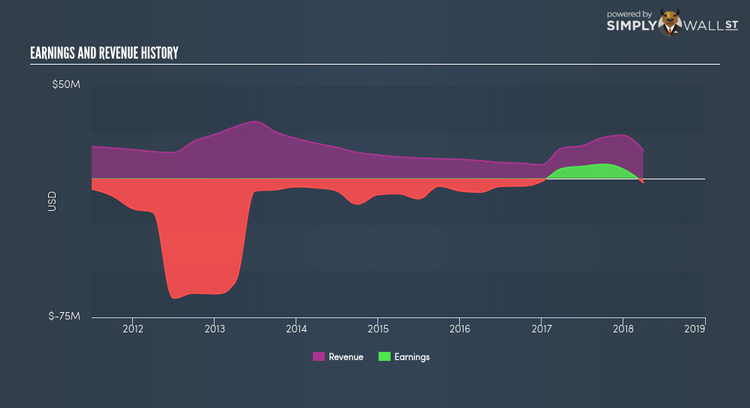
We can further examine Funcom’s loss by looking at what the industry has been experiencing over the past few years. Each year, for the past half a decade Funcom has seen an annual decline in revenue of -5.53%, on average. This adverse movement is a driver of the company’s inability to reach breakeven. Has the entire industry experienced this headwind? Inspecting growth from a sector-level, the NO software industry has been growing growth, more than doubling average earnings over the past twelve months, . This is a a notable change from a volatile drop of -2.01% in the past few years. This shows that whatever uplift the industry is benefiting from, Funcom has not been able to leverage it as much as its average peer.
What does this mean?
While past data is useful, it doesn’t tell the whole story. Companies that incur net loss is always difficult to envisage what will happen in the future and when. The most insightful step is to examine company-specific issues Funcom may be facing and whether management guidance has regularly been met in the past. I suggest you continue to research Funcom to get a better picture of the stock by looking at:
Financial Health: Is FUNCOM’s operations financially sustainable? Balance sheets can be hard to analyze, which is why we’ve done it for you. Check out our financial health checks here.
Other High-Performing Stocks: Are there other stocks that provide better prospects with proven track records? Explore our free list of these great stocks here.
NB: Figures in this article are calculated using data from the trailing twelve months from 31 March 2018. This may not be consistent with full year annual report figures.
To help readers see pass the short term volatility of the financial market, we aim to bring you a long-term focused research analysis purely driven by fundamental data. Note that our analysis does not factor in the latest price sensitive company announcements.
The author is an independent contributor and at the time of publication had no position in the stocks mentioned.
