
 Yahoo Finance
 Where James Fisher and Sons plc’s (LON:FSJ) Earnings Growth Stands Against Its Industry

Assessing James Fisher and Sons plc’s (LON:FSJ) performance as a company requires looking at more than just a years’ earnings data. Below, I will run you through a simple sense check to build perspective on how James Fisher and Sons is doing by comparing its most recent earnings with its historical trend, in addition to the performance of its infrastructure industry peers.
Check out our latest analysis for James Fisher and Sons
Did FSJ perform better than its track record and industry?
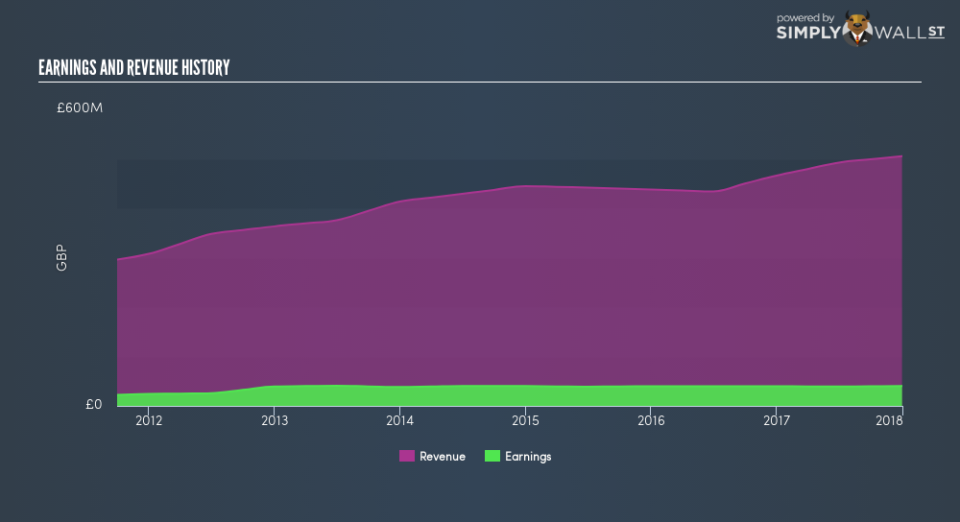
FSJ’s trailing twelve-month earnings (from 31 December 2017) of UK£40.2m has increased by 1.3% compared to the previous year. However, this one-year growth rate has been lower than its average earnings growth rate over the past 5 years of 5.5%, indicating the rate at which FSJ is growing has slowed down. Why could this be happening? Well, let’s take a look at what’s transpiring with margins and if the rest of the industry is feeling the heat.
Revenue growth in the last few years, has been positive, however, earnings growth has fallen behind meaning James Fisher and Sons has been ramping up its expenses by a lot more. This hurts margins and earnings, and is not a sustainable practice. Looking at growth from a sector-level, the UK infrastructure industry has been growing its average earnings by double-digit 12.1% over the past year, and a less exciting 9.3% over the previous five years. Since the Infrastructure sector in GB is relatively small, I’ve included similar companies in the wider region in order to get a better idea of the growth, which is a median of profitable companies of companies such as BBA Aviation, Ocean Wilsons Holdings and Zhejiang Expressway. This means any uplift the industry is benefiting from, James Fisher and Sons has not been able to realize the gains unlike its industry peers.
In terms of returns from investment, James Fisher and Sons has fallen short of achieving a 20% return on equity (ROE), recording 14.2% instead. However, its return on assets (ROA) of 7.2% exceeds the GB Infrastructure industry of 5.9%, indicating James Fisher and Sons has used its assets more efficiently. Though, its return on capital (ROC), which also accounts for James Fisher and Sons’s debt level, has declined over the past 3 years from 14.8% to 10.7%. This correlates with an increase in debt holding, with debt-to-equity ratio rising from 50.9% to 53.4% over the past 5 years.
What does this mean?
Though James Fisher and Sons’s past data is helpful, it is only one aspect of my investment thesis. Positive growth and profitability are what investors like to see in a company’s track record, but how do we properly assess sustainability? I suggest you continue to research James Fisher and Sons to get a better picture of the stock by looking at:
Financial Health: Are FSJ’s operations financially sustainable? Balance sheets can be hard to analyze, which is why we’ve done it for you. Check out our financial health checks here.
Valuation: What is FSJ worth today? Is the stock undervalued, even when its growth outlook is factored into its intrinsic value? The intrinsic value infographic in our free research report helps visualize whether FSJ is currently mispriced by the market.
Other High-Performing Stocks: Are there other stocks that provide better prospects with proven track records? Explore our free list of these great stocks here.
NB: Figures in this article are calculated using data from the trailing twelve months from 31 December 2017. This may not be consistent with full year annual report figures.
To help readers see past the short term volatility of the financial market, we aim to bring you a long-term focused research analysis purely driven by fundamental data. Note that our analysis does not factor in the latest price-sensitive company announcements.
The author is an independent contributor and at the time of publication had no position in the stocks mentioned. For errors that warrant correction please contact the editor at editorial-team@simplywallst.com.
