
 Yahoo Finance
 Where Taylor Wimpey plc (LON:TW.) Stands In Terms Of Earnings Growth Against Its Industry

After looking at Taylor Wimpey plc's (LSE:TW.) latest earnings announcement (30 June 2019), I found it useful to revisit the company's performance in the past couple of years and assess this against the most recent figures. As a long term investor, I pay close attention to earnings trend, rather than the figures published at one point in time. I also compare against an industry benchmark to check whether Taylor Wimpey's performance has been impacted by industry movements. In this article I briefly touch on my key findings.
See our latest analysis for Taylor Wimpey
Could TW. beat the long-term trend and outperform its industry?
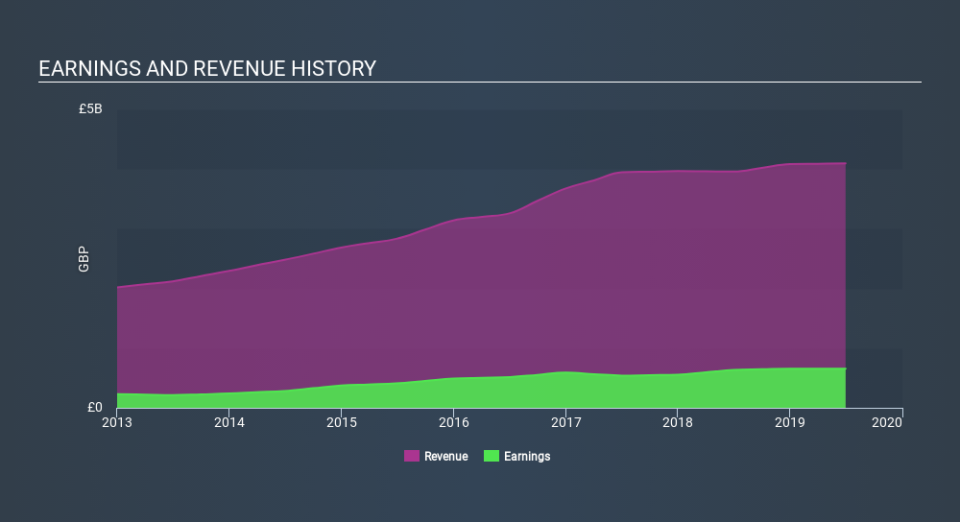
TW.'s trailing twelve-month earnings (from 30 June 2019) of UK£654m has increased by 3.2% compared to the previous year.
However, this one-year growth rate has been lower than its average earnings growth rate over the past 5 years of 13%, indicating the rate at which TW. is growing has slowed down. Why could this be happening? Well, let's examine what's going on with margins and whether the rest of the industry is feeling the heat.
In terms of returns from investment, Taylor Wimpey has invested its equity funds well leading to a 22% return on equity (ROE), above the sensible minimum of 20%. Furthermore, its return on assets (ROA) of 12% exceeds the GB Consumer Durables industry of 9.1%, indicating Taylor Wimpey has used its assets more efficiently. And finally, its return on capital (ROC), which also accounts for Taylor Wimpey’s debt level, has increased over the past 3 years from 19% to 22%. This correlates with a decrease in debt holding, with debt-to-equity ratio declining from 4.2% to 3.0% over the past 5 years.
What does this mean?
Though Taylor Wimpey's past data is helpful, it is only one aspect of my investment thesis. Positive growth and profitability are what investors like to see in a company’s track record, but how do we properly assess sustainability? I suggest you continue to research Taylor Wimpey to get a better picture of the stock by looking at:
Future Outlook: What are well-informed industry analysts predicting for TW.’s future growth? Take a look at our free research report of analyst consensus for TW.’s outlook.
Financial Health: Are TW.’s operations financially sustainable? Balance sheets can be hard to analyze, which is why we’ve done it for you. Check out our financial health checks here.
Other High-Performing Stocks: Are there other stocks that provide better prospects with proven track records? Explore our free list of these great stocks here.
NB: Figures in this article are calculated using data from the trailing twelve months from 30 June 2019. This may not be consistent with full year annual report figures.
If you spot an error that warrants correction, please contact the editor at editorial-team@simplywallst.com. This article by Simply Wall St is general in nature. It does not constitute a recommendation to buy or sell any stock, and does not take account of your objectives, or your financial situation. Simply Wall St has no position in the stocks mentioned.
We aim to bring you long-term focused research analysis driven by fundamental data. Note that our analysis may not factor in the latest price-sensitive company announcements or qualitative material. Thank you for reading.
