
 Yahoo Finance
 While Coherent (NYSE:COHR) shareholders have made 57% in 1 year, increasing losses might now be front of mind as stock sheds 3.4% this week
These days it's easy to simply buy an index fund, and your returns should (roughly) match the market. But investors can boost returns by picking market-beating companies to own shares in. For example, the Coherent Corp. (NYSE:COHR) share price is up 57% in the last 1 year, clearly besting the market return of around 26% (not including dividends). So that should have shareholders smiling. In contrast, the longer term returns are negative, since the share price is 20% lower than it was three years ago.
In light of the stock dropping 3.4% in the past week, we want to investigate the longer term story, and see if fundamentals have been the driver of the company's positive one-year return.
View our latest analysis for Coherent
To quote Buffett, 'Ships will sail around the world but the Flat Earth Society will flourish. There will continue to be wide discrepancies between price and value in the marketplace...' One imperfect but simple way to consider how the market perception of a company has shifted is to compare the change in the earnings per share (EPS) with the share price movement.
Over the last twelve months, Coherent actually shrank its EPS by 248%. We do note that there were extraordinary items impacting the result.
Given the share price gain, we doubt the market is measuring progress with EPS. Therefore, it seems likely that investors are putting more weight on metrics other than EPS, at the moment.
However the year on year revenue growth of 4.5% would help. Many businesses do go through a phase where they have to forgo some profits to drive business development, and sometimes its for the best.
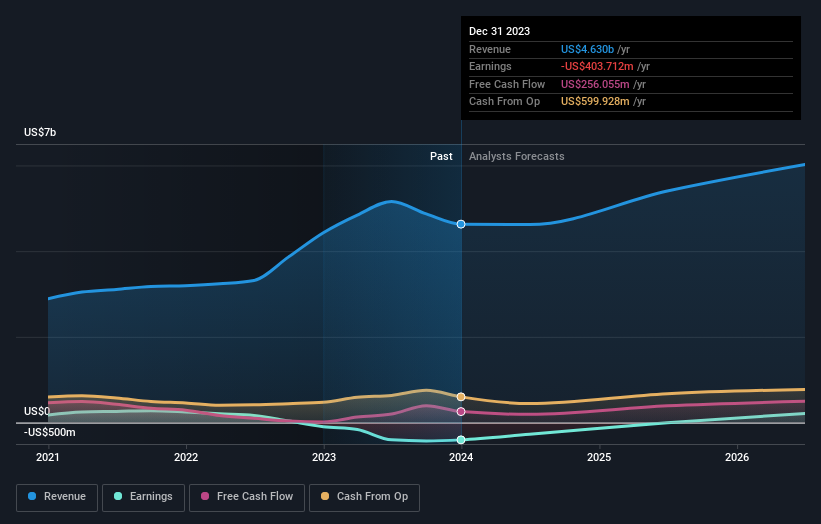
The company's revenue and earnings (over time) are depicted in the image below (click to see the exact numbers).
We like that insiders have been buying shares in the last twelve months. Having said that, most people consider earnings and revenue growth trends to be a more meaningful guide to the business. If you are thinking of buying or selling Coherent stock, you should check out this free report showing analyst profit forecasts.
A Different Perspective
We're pleased to report that Coherent shareholders have received a total shareholder return of 57% over one year. That gain is better than the annual TSR over five years, which is 8%. Therefore it seems like sentiment around the company has been positive lately. Given the share price momentum remains strong, it might be worth taking a closer look at the stock, lest you miss an opportunity. It's always interesting to track share price performance over the longer term. But to understand Coherent better, we need to consider many other factors. Consider for instance, the ever-present spectre of investment risk. We've identified 2 warning signs with Coherent (at least 1 which can't be ignored) , and understanding them should be part of your investment process.
Coherent is not the only stock insiders are buying. So take a peek at this free list of growing companies with insider buying.
Please note, the market returns quoted in this article reflect the market weighted average returns of stocks that currently trade on American exchanges.
Have feedback on this article? Concerned about the content? Get in touch with us directly. Alternatively, email editorial-team (at) simplywallst.com.
This article by Simply Wall St is general in nature. We provide commentary based on historical data and analyst forecasts only using an unbiased methodology and our articles are not intended to be financial advice. It does not constitute a recommendation to buy or sell any stock, and does not take account of your objectives, or your financial situation. We aim to bring you long-term focused analysis driven by fundamental data. Note that our analysis may not factor in the latest price-sensitive company announcements or qualitative material. Simply Wall St has no position in any stocks mentioned.
