
 Yahoo Finance
 Why The 23% Return On Capital At Torex Gold Resources (TSE:TXG) Should Have Your Attention
If you're looking for a multi-bagger, there's a few things to keep an eye out for. In a perfect world, we'd like to see a company investing more capital into its business and ideally the returns earned from that capital are also increasing. Ultimately, this demonstrates that it's a business that is reinvesting profits at increasing rates of return. With that in mind, the ROCE of Torex Gold Resources (TSE:TXG) looks great, so lets see what the trend can tell us.
Understanding Return On Capital Employed (ROCE)
For those who don't know, ROCE is a measure of a company's yearly pre-tax profit (its return), relative to the capital employed in the business. Analysts use this formula to calculate it for Torex Gold Resources:
Return on Capital Employed = Earnings Before Interest and Tax (EBIT) ÷ (Total Assets - Current Liabilities)
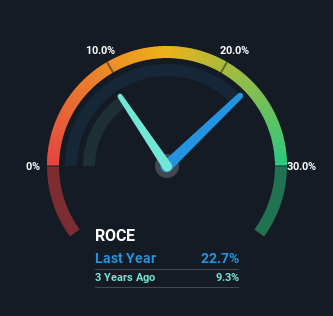
0.23 = US$289m ÷ (US$1.4b - US$161m) (Based on the trailing twelve months to June 2022).
Therefore, Torex Gold Resources has an ROCE of 23%. In absolute terms that's a great return and it's even better than the Metals and Mining industry average of 4.0%.
View our latest analysis for Torex Gold Resources
Above you can see how the current ROCE for Torex Gold Resources compares to its prior returns on capital, but there's only so much you can tell from the past. If you'd like to see what analysts are forecasting going forward, you should check out our free report for Torex Gold Resources.
What Can We Tell From Torex Gold Resources' ROCE Trend?
Torex Gold Resources' ROCE growth is quite impressive. Looking at the data, we can see that even though capital employed in the business has remained relatively flat, the ROCE generated has risen by 159% over the last five years. So it's likely that the business is now reaping the full benefits of its past investments, since the capital employed hasn't changed considerably. It's worth looking deeper into this though because while it's great that the business is more efficient, it might also mean that going forward the areas to invest internally for the organic growth are lacking.
In Conclusion...
As discussed above, Torex Gold Resources appears to be getting more proficient at generating returns since capital employed has remained flat but earnings (before interest and tax) are up. Astute investors may have an opportunity here because the stock has declined 58% in the last five years. So researching this company further and determining whether or not these trends will continue seems justified.
Torex Gold Resources does have some risks, we noticed 2 warning signs (and 1 which makes us a bit uncomfortable) we think you should know about.
If you want to search for more stocks that have been earning high returns, check out this free list of stocks with solid balance sheets that are also earning high returns on equity.
Have feedback on this article? Concerned about the content? Get in touch with us directly. Alternatively, email editorial-team (at) simplywallst.com.
This article by Simply Wall St is general in nature. We provide commentary based on historical data and analyst forecasts only using an unbiased methodology and our articles are not intended to be financial advice. It does not constitute a recommendation to buy or sell any stock, and does not take account of your objectives, or your financial situation. We aim to bring you long-term focused analysis driven by fundamental data. Note that our analysis may not factor in the latest price-sensitive company announcements or qualitative material. Simply Wall St has no position in any stocks mentioned.
Join A Paid User Research Session
You’ll receive a US$30 Amazon Gift card for 1 hour of your time while helping us build better investing tools for the individual investors like yourself. Sign up here
