
 Yahoo Finance
 Why Abcam plc’s (LON:ABC) High P/E Ratio Isn’t Necessarily A Bad Thing

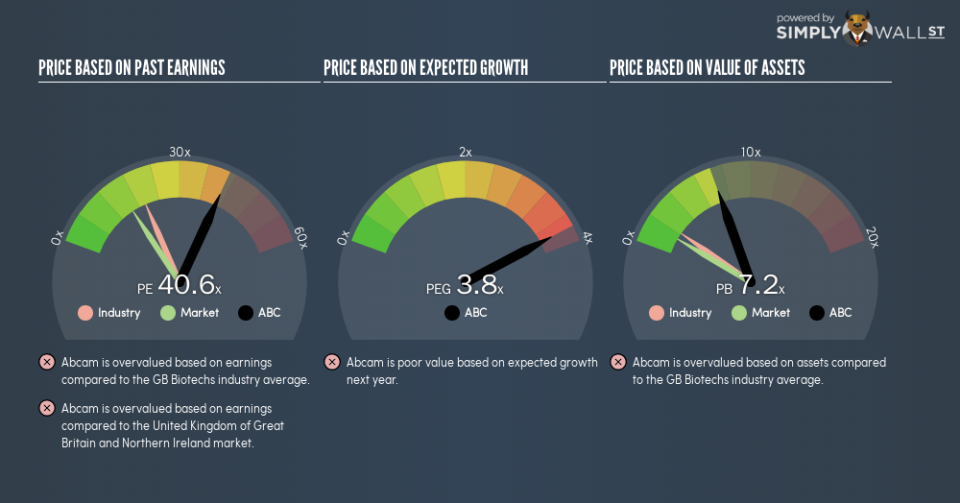
This article is written for those who want to get better at using price to earnings ratios (P/E ratios). We’ll look at Abcam plc’s (LON:ABC) P/E ratio and reflect on what it tells us about the company’s share price. Abcam has a P/E ratio of 40.61, based on the last twelve months. That means that at current prices, buyers pay £40.61 for every £1 in trailing yearly profits.
Check out our latest analysis for Abcam
How Do I Calculate A Price To Earnings Ratio?
The formula for P/E is:
Price to Earnings Ratio = Share Price ÷ Earnings per Share (EPS)
Or for Abcam:
P/E of 40.61 = £12.37 ÷ £0.30 (Based on the trailing twelve months to June 2018.)
Is A High Price-to-Earnings Ratio Good?
A higher P/E ratio implies that investors pay a higher price for the earning power of the business. That is not a good or a bad thing per se, but a high P/E does imply buyers are optimistic about the future.
How Growth Rates Impact P/E Ratios
P/E ratios primarily reflect market expectations around earnings growth rates. That’s because companies that grow earnings per share quickly will rapidly increase the ‘E’ in the equation. That means even if the current P/E is high, it will reduce over time if the share price stays flat. A lower P/E should indicate the stock is cheap relative to others — and that may attract buyers.
Notably, Abcam grew EPS by a whopping 46% in the last year. And it has bolstered its earnings per share by 11% per year over the last five years. With that performance, I would expect it to have an above average P/E ratio.
How Does Abcam’s P/E Ratio Compare To Its Peers?
The P/E ratio indicates whether the market has higher or lower expectations of a company. As you can see below, Abcam has a higher P/E than the average company (20) in the biotechs industry.
Abcam’s P/E tells us that market participants think the company will perform better than its industry peers, going forward. Clearly the market expects growth, but it isn’t guaranteed. So further research is always essential. I often monitor director buying and selling.
Remember: P/E Ratios Don’t Consider The Balance Sheet
It’s important to note that the P/E ratio considers the market capitalization, not the enterprise value. In other words, it does not consider any debt or cash that the company may have on the balance sheet. Hypothetically, a company could reduce its future P/E ratio by spending its cash (or taking on debt) to achieve higher earnings.
Such spending might be good or bad, overall, but the key point here is that you need to look at debt to understand the P/E ratio in context.
Is Debt Impacting Abcam’s P/E?
The extra options and safety that comes with Abcam’s UK£90m net cash position means that it deserves a higher P/E than it would if it had a lot of net debt.
The Bottom Line On Abcam’s P/E Ratio
Abcam has a P/E of 40.6. That’s higher than the average in the GB market, which is 15.8. Its net cash position supports a higher P/E ratio, as does its solid recent earnings growth. So it is not surprising the market is probably extrapolating recent growth well into the future, reflected in the relatively high P/E ratio.
When the market is wrong about a stock, it gives savvy investors an opportunity. People often underestimate remarkable growth — so investors can make money when fast growth is not fully appreciated. So this free visualization of the analyst consensus on future earnings could help you make the right decision about whether to buy, sell, or hold.
Of course, you might find a fantastic investment by looking at a few good candidates. So take a peek at this free list of companies with modest (or no) debt, trading on a P/E below 20.
To help readers see past the short term volatility of the financial market, we aim to bring you a long-term focused research analysis purely driven by fundamental data. Note that our analysis does not factor in the latest price-sensitive company announcements.
The author is an independent contributor and at the time of publication had no position in the stocks mentioned. For errors that warrant correction please contact the editor at editorial-team@simplywallst.com.
