
 Yahoo Finance
 Why Alphabet Inc.’s (NASDAQ:GOOG.L) Return On Capital Employed Is Impressive

Today we'll look at Alphabet Inc. (NASDAQ:GOOG.L) and reflect on its potential as an investment. To be precise, we'll consider its Return On Capital Employed (ROCE), as that will inform our view of the quality of the business.
First of all, we'll work out how to calculate ROCE. Then we'll compare its ROCE to similar companies. And finally, we'll look at how its current liabilities are impacting its ROCE.
Return On Capital Employed (ROCE): What is it?
ROCE is a measure of a company's yearly pre-tax profit (its return), relative to the capital employed in the business. In general, businesses with a higher ROCE are usually better quality. Ultimately, it is a useful but imperfect metric. Author Edwin Whiting says to be careful when comparing the ROCE of different businesses, since 'No two businesses are exactly alike.
How Do You Calculate Return On Capital Employed?
The formula for calculating the return on capital employed is:
Return on Capital Employed = Earnings Before Interest and Tax (EBIT) ÷ (Total Assets - Current Liabilities)
Or for Alphabet:
0.16 = US$36b ÷ (US$273b - US$40b) (Based on the trailing twelve months to March 2020.)
Therefore, Alphabet has an ROCE of 16%.
View our latest analysis for Alphabet
Is Alphabet's ROCE Good?
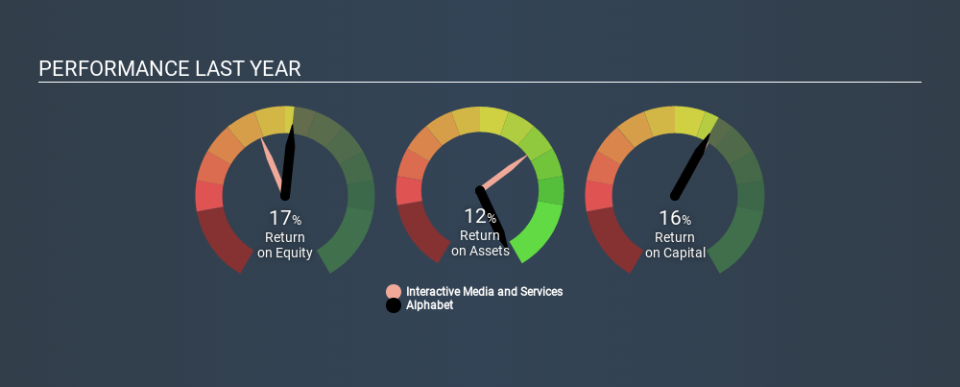
When making comparisons between similar businesses, investors may find ROCE useful. Alphabet's ROCE appears to be substantially greater than the 8.1% average in the Interactive Media and Services industry. I think that's good to see, since it implies the company is better than other companies at making the most of its capital. Regardless of where Alphabet sits next to its industry, its ROCE in absolute terms appears satisfactory, and this company could be worth a closer look.
The image below shows how Alphabet's ROCE compares to its industry, and you can click it to see more detail on its past growth.
When considering ROCE, bear in mind that it reflects the past and does not necessarily predict the future. Companies in cyclical industries can be difficult to understand using ROCE, as returns typically look high during boom times, and low during busts. ROCE is, after all, simply a snap shot of a single year. Since the future is so important for investors, you should check out our free report on analyst forecasts for Alphabet.
Do Alphabet's Current Liabilities Skew Its ROCE?
Short term (or current) liabilities, are things like supplier invoices, overdrafts, or tax bills that need to be paid within 12 months. Due to the way ROCE is calculated, a high level of current liabilities makes a company look as though it has less capital employed, and thus can (sometimes unfairly) boost the ROCE. To counter this, investors can check if a company has high current liabilities relative to total assets.
Alphabet has total assets of US$273b and current liabilities of US$40b. Therefore its current liabilities are equivalent to approximately 15% of its total assets. Low current liabilities are not boosting the ROCE too much.
The Bottom Line On Alphabet's ROCE
This is good to see, and with a sound ROCE, Alphabet could be worth a closer look. Alphabet looks strong on this analysis, but there are plenty of other companies that could be a good opportunity . Here is a free list of companies growing earnings rapidly.
I will like Alphabet better if I see some big insider buys. While we wait, check out this free list of growing companies with considerable, recent, insider buying.
Love or hate this article? Concerned about the content? Get in touch with us directly. Alternatively, email editorial-team@simplywallst.com.
This article by Simply Wall St is general in nature. It does not constitute a recommendation to buy or sell any stock, and does not take account of your objectives, or your financial situation. We aim to bring you long-term focused analysis driven by fundamental data. Note that our analysis may not factor in the latest price-sensitive company announcements or qualitative material. Simply Wall St has no position in any stocks mentioned. Thank you for reading.
