
 Yahoo Finance
 Why ASOS Plc’s (LON:ASC) High P/E Ratio Isn’t Necessarily A Bad Thing

The goal of this article is to teach you how to use price to earnings ratios (P/E ratios). We’ll look at ASOS Plc’s (LON:ASC) P/E ratio and reflect on what it tells us about the company’s share price. ASOS has a price to earnings ratio of 32.76, based on the last twelve months. That corresponds to an earnings yield of approximately 3.1%.
See our latest analysis for ASOS
How Do You Calculate A P/E Ratio?
The formula for P/E is:
Price to Earnings Ratio = Price per Share ÷ Earnings per Share (EPS)
Or for ASOS:
P/E of 32.76 = £32.41 ÷ £0.99 (Based on the trailing twelve months to August 2018.)
Is A High Price-to-Earnings Ratio Good?
A higher P/E ratio implies that investors pay a higher price for the earning power of the business. That isn’t a good or a bad thing on its own, but a high P/E means that buyers have a higher opinion of the business’s prospects, relative to stocks with a lower P/E.
How Growth Rates Impact P/E Ratios
Probably the most important factor in determining what P/E a company trades on is the earnings growth. Earnings growth means that in the future the ‘E’ will be higher. That means even if the current P/E is high, it will reduce over time if the share price stays flat. Then, a lower P/E should attract more buyers, pushing the share price up.
It’s nice to see that ASOS grew EPS by a stonking 28% in the last year. And its annual EPS growth rate over 5 years is 15%. So we’d generally expect it to have a relatively high P/E ratio.
How Does ASOS’s P/E Ratio Compare To Its Peers?
The P/E ratio indicates whether the market has higher or lower expectations of a company. The image below shows that ASOS has a higher P/E than the average (25.4) P/E for companies in the online retail industry.
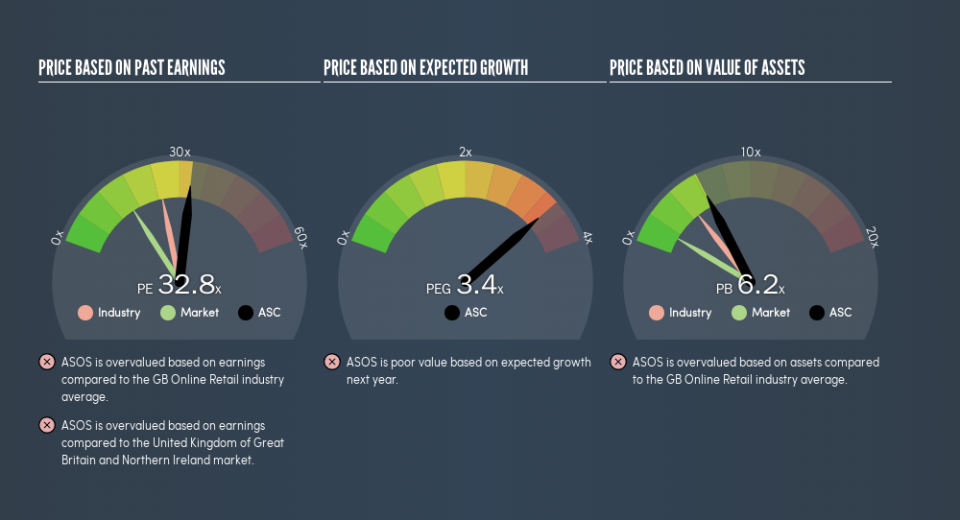
Its relatively high P/E ratio indicates that ASOS shareholders think it will perform better than other companies in its industry classification. Shareholders are clearly optimistic, but the future is always uncertain. So further research is always essential. I often monitor director buying and selling.
Remember: P/E Ratios Don’t Consider The Balance Sheet
It’s important to note that the P/E ratio considers the market capitalization, not the enterprise value. In other words, it does not consider any debt or cash that the company may have on the balance sheet. In theory, a company can lower its future P/E ratio by using cash or debt to invest in growth.
Such spending might be good or bad, overall, but the key point here is that you need to look at debt to understand the P/E ratio in context.
Is Debt Impacting ASOS’s P/E?
The extra options and safety that comes with ASOS’s UK£43m net cash position means that it deserves a higher P/E than it would if it had a lot of net debt.
The Bottom Line On ASOS’s P/E Ratio
ASOS trades on a P/E ratio of 32.8, which is above the GB market average of 16.1. Its net cash position supports a higher P/E ratio, as does its solid recent earnings growth. So it is not surprising the market is probably extrapolating recent growth well into the future, reflected in the relatively high P/E ratio.
When the market is wrong about a stock, it gives savvy investors an opportunity. As value investor Benjamin Graham famously said, ‘In the short run, the market is a voting machine but in the long run, it is a weighing machine.’ So this free visualization of the analyst consensus on future earnings could help you make the right decision about whether to buy, sell, or hold.
But note: ASOS may not be the best stock to buy. So take a peek at this free list of interesting companies with strong recent earnings growth (and a P/E ratio below 20).
We aim to bring you long-term focused research analysis driven by fundamental data. Note that our analysis may not factor in the latest price-sensitive company announcements or qualitative material.
If you spot an error that warrants correction, please contact the editor at editorial-team@simplywallst.com. This article by Simply Wall St is general in nature. It does not constitute a recommendation to buy or sell any stock, and does not take account of your objectives, or your financial situation. Simply Wall St has no position in the stocks mentioned. Thank you for reading.
