
 Yahoo Finance
 Why Auburn National Bancorporation, Inc.’s (NASDAQ:AUBN) Risk Control Makes It Attractive

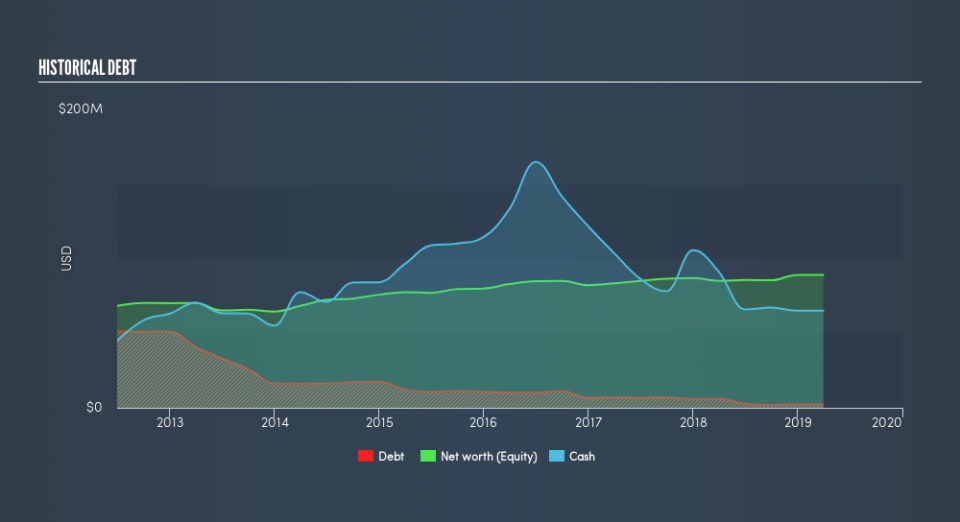
Improving credit quality as a result of post-GFC recovery has led to a strong environment for growth in the banking sector. Auburn National Bancorporation, Inc. (NASDAQ:AUBN) is a small-cap bank with a market capitalisation of US$127m. Its profit and value are directly impacted by its borrowers’ ability to pay which is driven by the level of economic growth. This is because growth determines the stability of a borrower’s salary as well as the level of interest rates. Risk associated with repayment is measured by bad debt which is written off as an expense, impacting Auburn National Bancorporation’s bottom line. Today I will take you through some bad debt and liability measures to analyse the level of risky assets held by the bank. Looking through a risk-lens is a useful way to assess the attractiveness of Auburn National Bancorporation's a stock investment.
View our latest analysis for Auburn National Bancorporation
How Good Is Auburn National Bancorporation At Forecasting Its Risks?
The ability for Auburn National Bancorporation to accurately forecast and provision for its bad loans shows it has a strong understanding of the level of risk it is taking on. We generally prefer to see that a provisions covers close to 100% of what it actually writes off, as this could imply a sensible and conservative approach towards bad loans. Given its large non-performing loan allowance to non-performing loan ratio of over 500%, Auburn National Bancorporation has over-provisioned relative to its current level of non-performing loans, which could indicate the bank is expecting to incur further bad loans in the near future.
What Is An Appropriate Level Of Risk?
Auburn National Bancorporation’s operations expose it to risky assets by lending to borrowers who may not be able to repay their loans. Loans that cannot be recuperated by the bank, also known as bad loans, should typically form less than 3% of its total loans. When these loans are not repaid, they are written off as expenses which comes out directly from Auburn National Bancorporation’s profit. Since bad loans only make up an insignificant 0.037% of its total assets, the bank may have very strict risk management - or perhaps the risks in its portfolio have not eventuated yet.
How Big Is Auburn National Bancorporation’s Safety Net?

Auburn National Bancorporation makes money by lending out its various forms of borrowings. Deposits from customers tend to bear the lowest risk given the relatively stable amount available and interest rate. The general rule is the higher level of deposits a bank holds, the less risky it is considered to be. Since Auburn National Bancorporation’s total deposit to total liabilities is very high at 99% which is well-above the prudent level of 50% for banks, Auburn National Bancorporation may be too cautious with its level of deposits and has plenty of headroom to take on risker forms of liability.
Next Steps:
The recent acquisition is expected to bring more opportunities for AUBN, which in turn should lead to stronger growth. I would stay up-to-date on how this decision will affect the future of the business in terms of earnings growth and financial health. Below, I've listed three fundamental areas on Simply Wall St's dashboard for a quick visualization on current trends for AUBN. I've also used this site as a source of data for my article.
Future Outlook: What are well-informed industry analysts predicting for AUBN’s future growth? Take a look at our free research report of analyst consensus for AUBN’s outlook.
Valuation: What is AUBN worth today? Has the future growth potential already been factored into the price? The intrinsic value infographic in our free research report helps visualize whether AUBN is currently mispriced by the market.
Other High-Performing Stocks: Are there other stocks that provide better prospects with proven track records? Explore our free list of these great stocks here.
We aim to bring you long-term focused research analysis driven by fundamental data. Note that our analysis may not factor in the latest price-sensitive company announcements or qualitative material.
If you spot an error that warrants correction, please contact the editor at editorial-team@simplywallst.com. This article by Simply Wall St is general in nature. It does not constitute a recommendation to buy or sell any stock, and does not take account of your objectives, or your financial situation. Simply Wall St has no position in the stocks mentioned. Thank you for reading.
