
 Yahoo Finance
 Why is B&G Foods Inc (BGS) intrinsic value above its September share price?

How far off is B&G Foods (NYSE:BGS) to its intrinsic value? I am going to take a look now by taking the expected future cash flows and discounted them to the value today. A discounted cash flow (DCF) analysis represents the net present value (NPV) of projected cash flows to a stock. Don't get put off by the jargon, the math behind it is actually quite straightforward.
Anyone interested in learning a bit more about intrinsic value should have a read of the Simply Wall St analysis model.
If you are reading this and its not September 2017 then I highly recommend you check out the latest calculation for B&G Foods by following the link below. View our latest analysis for B&G Foods

We are going to use a two stage model that takes into account two stages of growth. The first stage may have a high growth rate and the second stage is usually assumed to have a stable growth rate. To begin with we have to get estimates of the next 5 years of cash flows, where possible I use analysts estimates but when these aren't available I have extrapolated the previous Free Cash Flow (FCF) from the year before. For this growth rate I used the average annual growth rate over the past 5 years, but capped to a reasonable level. The sum of these cash flows is then discounted to today's value.
The calculation
Please note that the numbers here are in millions apart from the per share values.
5-year cash flow estimate
2017 | 2018 | 2019 | 2020 | 2021 | |
Levered FCF (USD, Millions) | $112.24 | $193.93 | $212.00 | $248.04 | $287.73 |
Source | Analyst x2 | Analyst x2 | Analyst x1 | Extrapolated @ (17%, capped from 23.46%) | Extrapolated @ (16%, capped from 23.46%) |
Present Value Discounted @ 8.68% | $103.28 | $164.19 | $165.15 | $177.80 | $189.77 |
Present value of next 5 years cash flows: $800
The 2nd stage is also known as Terminal Value, this is the cash flows to the business after the 1st stage. For a number of reasons a very conservative rate is used that cannot exceed that of the GDP. In this case I have used the 10 year government bond rate (2.3%). In the same way as with the 5 year 'growth' period we discount this to today's value.
Terminal Value
Terminal Value = FCF2021 × (1 + g) ÷ (Discount Rate – g)
Terminal Value = $288 × (1 + 2.3%) ÷ (8.7% – 2.3%)
Terminal value based on the Perpetuity Method where growth (g) = 2.3%: $4,637
Present value of terminal value: $3,058
The total value or equity value is then the sum of of the present value of the cash flows.
Equity Value
Equity Value (Total value) = Present value of next 5 years cash flows + terminal value = $800 + $3,058 = $3,858
In the final step we divide the equity value by the number of shares outstanding. If the stock is an depositary receipt (represents a specified number of shares in a foreign corporation) or ADR then we use the equivalent number.
Value = Total value / Shares Outstanding ($3,858.23 / 66.50)
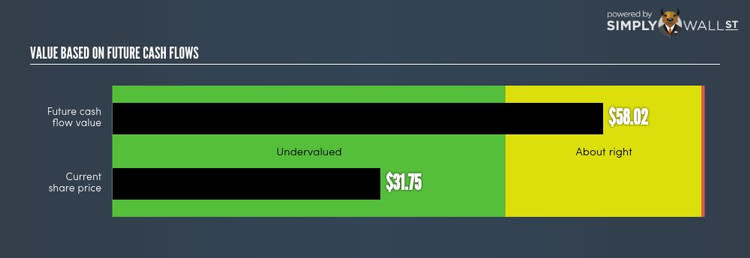
Value per share: $58.02
Now when we compare the intrinsic value of 58.02 to the current share price of $31.75 we see B&G Foods (NYSE:BGS) is quite undervalued at a 45% discount to what it is available for right now.
Important assumptions
I'd like to point out that the most important inputs to a discounted cash flow are the discount rate and of course the actual cash flows. You don't have to agree with my inputs, I recommend redoing the calculations yourself and playing with them. Because we are looking at B&G Foods as potential investors the Cost of Equity is used as the discount rate, not the Cost of Capital (or Weighed Average Cost of Capital/ WACC) which accounts for debt.
In this calculation I've used 8.7% and this is based on a Levered Beta of 0.828. I'm not going to go into how I calculate the Levered Beta in detail, I used the 'Bottom up Beta' method based on the comparable businesses, I also impose a limit between 0.8 and 2 which is a reasonable range for a stable business. Google this if you want to learn more.
Final Words
Whilst important, DCF calculation shouldn’t be the only metric you look at when researching a company. Is B&G Foods in a healthy financial condition? What is the reason for the share price to differ from the intrinsic value? See our latest FREE analysis to find out!
PS. Not interested in BGS anymore? Use our free platform to discover stocks undervalued by more than 20% based on their DCF valuation.
To help readers see pass the short term volatility of the financial market, we aim to bring you a long-term focused research analysis purely driven by fundamental data. Note that our analysis does not factor in the latest price sensitive company announcements.
The author is an independent contributor and at the time of publication had no position in the stocks mentioned.
