
 Yahoo Finance
 Why Barco NV (EBR:BAR) Is A Financially Healthy Company
Want to participate in a short research study? Help shape the future of investing tools and you could win a $250 gift card!
Mid-caps stocks, like Barco NV (EBR:BAR) with a market capitalization of €2.3b, aren’t the focus of most investors who prefer to direct their investments towards either large-cap or small-cap stocks. Surprisingly though, when accounted for risk, mid-caps have delivered better returns compared to the two other categories of stocks. Let’s take a look at BAR’s debt concentration and assess their financial liquidity to get an idea of their ability to fund strategic acquisitions and grow through cyclical pressures. Note that this information is centred entirely on financial health and is a top-level understanding, so I encourage you to look further into BAR here.
View our latest analysis for Barco
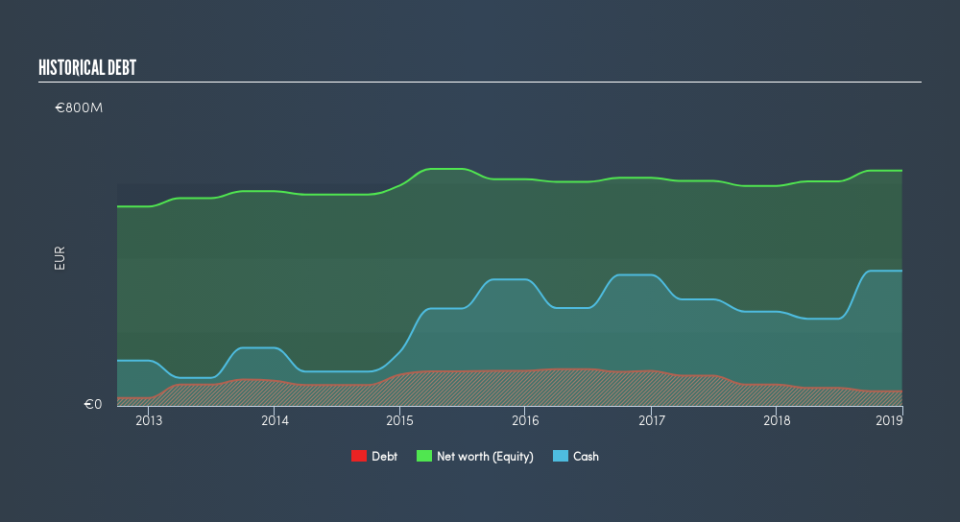
BAR’s Debt (And Cash Flows)
BAR has shrunk its total debt levels in the last twelve months, from €58m to €40m – this includes long-term debt. With this reduction in debt, the current cash and short-term investment levels stands at €365m to keep the business going. On top of this, BAR has produced cash from operations of €90m in the last twelve months, leading to an operating cash to total debt ratio of 226%, meaning that BAR’s operating cash is sufficient to cover its debt.
Can BAR pay its short-term liabilities?
At the current liabilities level of €320m, it appears that the company has been able to meet these obligations given the level of current assets of €689m, with a current ratio of 2.15x. The current ratio is the number you get when you divide current assets by current liabilities. For Electronic companies, this ratio is within a sensible range since there's a sufficient cash cushion without leaving too much capital idle or in low-earning investments.
Does BAR face the risk of succumbing to its debt-load?
With a debt-to-equity ratio of 6.3%, BAR's debt level is relatively low. This range is considered safe as BAR is not taking on too much debt obligation, which may be constraining for future growth.
Next Steps:
BAR’s high cash coverage and low debt levels indicate its ability to utilise its borrowings efficiently in order to generate ample cash flow. Furthermore, the company exhibits an ability to meet its near term obligations should an adverse event occur. I admit this is a fairly basic analysis for BAR's financial health. Other important fundamentals need to be considered alongside. I suggest you continue to research Barco to get a better picture of the stock by looking at:
Future Outlook: What are well-informed industry analysts predicting for BAR’s future growth? Take a look at our free research report of analyst consensus for BAR’s outlook.
Valuation: What is BAR worth today? Is the stock undervalued, even when its growth outlook is factored into its intrinsic value? The intrinsic value infographic in our free research report helps visualize whether BAR is currently mispriced by the market.
Other High-Performing Stocks: Are there other stocks that provide better prospects with proven track records? Explore our free list of these great stocks here.
We aim to bring you long-term focused research analysis driven by fundamental data. Note that our analysis may not factor in the latest price-sensitive company announcements or qualitative material.
If you spot an error that warrants correction, please contact the editor at editorial-team@simplywallst.com. This article by Simply Wall St is general in nature. It does not constitute a recommendation to buy or sell any stock, and does not take account of your objectives, or your financial situation. Simply Wall St has no position in the stocks mentioned. Thank you for reading.
