
 Yahoo Finance
 Why You Should Care About E.ON SE’s (ETR:EOAN) Low Return On Capital

Today we'll evaluate E.ON SE (ETR:EOAN) to determine whether it could have potential as an investment idea. Specifically, we'll consider its Return On Capital Employed (ROCE), since that will give us an insight into how efficiently the business can generate profits from the capital it requires.
First, we'll go over how we calculate ROCE. Next, we'll compare it to others in its industry. And finally, we'll look at how its current liabilities are impacting its ROCE.
Understanding Return On Capital Employed (ROCE)
ROCE is a metric for evaluating how much pre-tax income (in percentage terms) a company earns on the capital invested in its business. Generally speaking a higher ROCE is better. Overall, it is a valuable metric that has its flaws. Renowned investment researcher Michael Mauboussin has suggested that a high ROCE can indicate that 'one dollar invested in the company generates value of more than one dollar'.
How Do You Calculate Return On Capital Employed?
Analysts use this formula to calculate return on capital employed:
Return on Capital Employed = Earnings Before Interest and Tax (EBIT) ÷ (Total Assets - Current Liabilities)
Or for E.ON:
0.038 = €1.4b ÷ (€54b - €16b) (Based on the trailing twelve months to June 2019.)
So, E.ON has an ROCE of 3.8%.
View our latest analysis for E.ON
Is E.ON's ROCE Good?
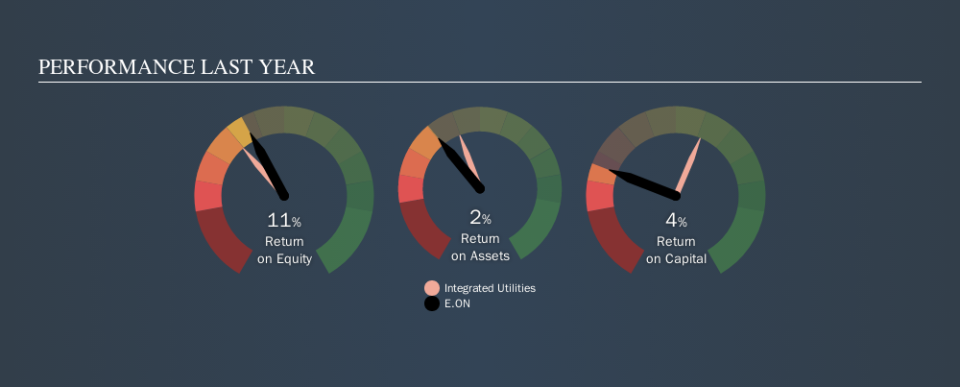
ROCE can be useful when making comparisons, such as between similar companies. We can see E.ON's ROCE is meaningfully below the Integrated Utilities industry average of 5.2%. This performance could be negative if sustained, as it suggests the business may underperform its industry. Separate from how E.ON stacks up against its industry, its ROCE in absolute terms is mediocre; relative to the returns on government bonds. Readers may find more attractive investment prospects elsewhere.
E.ON's current ROCE of 3.8% is lower than its ROCE in the past, which was 15%, 3 years ago. This makes us wonder if the business is facing new challenges. The image below shows how E.ON's ROCE compares to its industry, and you can click it to see more detail on its past growth.
When considering ROCE, bear in mind that it reflects the past and does not necessarily predict the future. Companies in cyclical industries can be difficult to understand using ROCE, as returns typically look high during boom times, and low during busts. ROCE is, after all, simply a snap shot of a single year. What happens in the future is pretty important for investors, so we have prepared a free report on analyst forecasts for E.ON.
Do E.ON's Current Liabilities Skew Its ROCE?
Short term (or current) liabilities, are things like supplier invoices, overdrafts, or tax bills that need to be paid within 12 months. The ROCE equation subtracts current liabilities from capital employed, so a company with a lot of current liabilities appears to have less capital employed, and a higher ROCE than otherwise. To counter this, investors can check if a company has high current liabilities relative to total assets.
E.ON has total assets of €54b and current liabilities of €16b. As a result, its current liabilities are equal to approximately 29% of its total assets. It is good to see a restrained amount of current liabilities, as this limits the effect on ROCE.
The Bottom Line On E.ON's ROCE
With that in mind, we're not overly impressed with E.ON's ROCE, so it may not be the most appealing prospect. Of course, you might find a fantastic investment by looking at a few good candidates. So take a peek at this free list of companies with modest (or no) debt, trading on a P/E below 20.
If you like to buy stocks alongside management, then you might just love this free list of companies. (Hint: insiders have been buying them).
We aim to bring you long-term focused research analysis driven by fundamental data. Note that our analysis may not factor in the latest price-sensitive company announcements or qualitative material.
If you spot an error that warrants correction, please contact the editor at editorial-team@simplywallst.com. This article by Simply Wall St is general in nature. It does not constitute a recommendation to buy or sell any stock, and does not take account of your objectives, or your financial situation. Simply Wall St has no position in the stocks mentioned. Thank you for reading.
