
 Yahoo Finance
 Why You Should Care About IDT's (NYSE:IDT) Strong Returns On Capital
If you're looking for a multi-bagger, there's a few things to keep an eye out for. Firstly, we'd want to identify a growing return on capital employed (ROCE) and then alongside that, an ever-increasing base of capital employed. Put simply, these types of businesses are compounding machines, meaning they are continually reinvesting their earnings at ever-higher rates of return. So, when we ran our eye over IDT's (NYSE:IDT) trend of ROCE, we really liked what we saw.
Understanding Return On Capital Employed (ROCE)
For those that aren't sure what ROCE is, it measures the amount of pre-tax profits a company can generate from the capital employed in its business. The formula for this calculation on IDT is:
Return on Capital Employed = Earnings Before Interest and Tax (EBIT) ÷ (Total Assets - Current Liabilities)
0.27 = US$63m ÷ (US$522m - US$285m) (Based on the trailing twelve months to January 2024).
So, IDT has an ROCE of 27%. In absolute terms that's a great return and it's even better than the Telecom industry average of 5.6%.
Check out our latest analysis for IDT
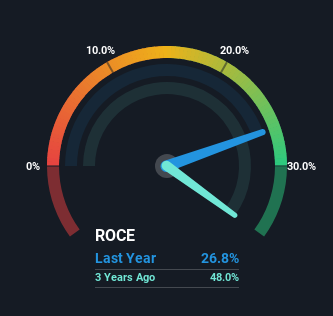
Historical performance is a great place to start when researching a stock so above you can see the gauge for IDT's ROCE against it's prior returns. If you're interested in investigating IDT's past further, check out this free graph covering IDT's past earnings, revenue and cash flow.
What Can We Tell From IDT's ROCE Trend?
We'd be pretty happy with returns on capital like IDT. The company has employed 334% more capital in the last five years, and the returns on that capital have remained stable at 27%. With returns that high, it's great that the business can continually reinvest its money at such appealing rates of return. If IDT can keep this up, we'd be very optimistic about its future.
One more thing to note, even though ROCE has remained relatively flat over the last five years, the reduction in current liabilities to 55% of total assets, is good to see from a business owner's perspective. Effectively suppliers now fund less of the business, which can lower some elements of risk. Although because current liabilities are still 55%, some of that risk is still prevalent.
The Bottom Line On IDT's ROCE
In short, we'd argue IDT has the makings of a multi-bagger since its been able to compound its capital at very profitable rates of return. And the stock has done incredibly well with a 431% return over the last five years, so long term investors are no doubt ecstatic with that result. So even though the stock might be more "expensive" than it was before, we think the strong fundamentals warrant this stock for further research.
One more thing, we've spotted 1 warning sign facing IDT that you might find interesting.
IDT is not the only stock earning high returns. If you'd like to see more, check out our free list of companies earning high returns on equity with solid fundamentals.
Have feedback on this article? Concerned about the content? Get in touch with us directly. Alternatively, email editorial-team (at) simplywallst.com.
This article by Simply Wall St is general in nature. We provide commentary based on historical data and analyst forecasts only using an unbiased methodology and our articles are not intended to be financial advice. It does not constitute a recommendation to buy or sell any stock, and does not take account of your objectives, or your financial situation. We aim to bring you long-term focused analysis driven by fundamental data. Note that our analysis may not factor in the latest price-sensitive company announcements or qualitative material. Simply Wall St has no position in any stocks mentioned.
