
 Yahoo Finance
 Why Dividend Hunters Love Peabody Energy Corporation (NYSE:BTU)

Is Peabody Energy Corporation (NYSE:BTU) a good dividend stock? How can we tell? Dividend paying companies with growing earnings can be highly rewarding in the long term. On the other hand, investors have been known to buy a stock because of its yield, and then lose money if the company's dividend doesn't live up to expectations.
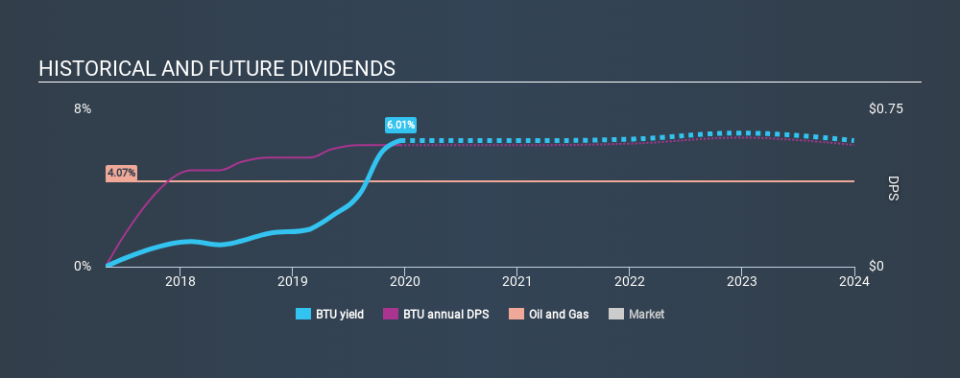
In this case, Peabody Energy pays a decent-sized 6.0% dividend yield, and has been distributing cash to shareholders for the past two years. A high yield probably looks enticing, but investors are likely wondering about the short payment history. During the year, the company also conducted a buyback equivalent to around 48% of its market capitalisation. Remember that the recent share price drop will make Peabody Energy's yield look higher, even though recent events might have impacted the company's prospects. When buying stocks for their dividends, you should always run through the checks below, to see if the dividend looks sustainable.
Click the interactive chart for our full dividend analysis
Payout ratios
Companies (usually) pay dividends out of their earnings. If a company is paying more than it earns, the dividend might have to be cut. Comparing dividend payments to a company's net profit after tax is a simple way of reality-checking whether a dividend is sustainable. In the last year, Peabody Energy paid out 19% of its profit as dividends. We like this low payout ratio, because it implies the dividend is well covered and leaves ample opportunity for reinvestment.
We also measure dividends paid against a company's levered free cash flow, to see if enough cash was generated to cover the dividend. Peabody Energy paid out 12% of its free cash flow as dividends last year, which is conservative and suggests the dividend is sustainable. It's encouraging to see that the dividend is covered by both profit and cash flow. This generally suggests the dividend is sustainable, as long as earnings don't drop precipitously.
Is Peabody Energy's Balance Sheet Risky?
As Peabody Energy has a meaningful amount of debt, we need to check its balance sheet to see if the company might have debt risks. A quick check of its financial situation can be done with two ratios: net debt divided by EBITDA (earnings before interest, tax, depreciation and amortisation), and net interest cover. Net debt to EBITDA measures total debt load relative to company earnings (lower = less debt), while net interest cover measures the ability to pay interest on the debt (higher = greater ability to pay interest costs). Peabody Energy has net debt of 0.62 times its EBITDA, which we think is not too troublesome.
Net interest cover can be calculated by dividing earnings before interest and tax (EBIT) by the company's net interest expense. Interest cover of 2.73 times its interest expense is starting to become a concern for Peabody Energy, and be aware that lenders may place additional restrictions on the company as well.
We update our data on Peabody Energy every 24 hours, so you can always get our latest analysis of its financial health, here.
Dividend Volatility
From the perspective of an income investor who wants to earn dividends for many years, there is not much point buying a stock if its dividend is regularly cut or is not reliable. The dividend has not fluctuated much, but with a relatively short payment history, we can't be sure this is sustainable across a full market cycle. During the past two-year period, the first annual payment was US$0.46 in 2017, compared to US$0.58 last year. This works out to be a compound annual growth rate (CAGR) of approximately 12% a year over that time.
The dividend has been growing pretty quickly, which could be enough to get us interested even though the dividend history is relatively short. Further research may be warranted.
Dividend Growth Potential
While dividend payments have been relatively reliable, it would also be nice if earnings per share (EPS) were growing, as this is essential to maintaining the dividend's purchasing power over the long term. Strong earnings per share (EPS) growth might encourage our interest in the company despite fluctuating dividends, which is why it's great to see Peabody Energy has grown its earnings per share at 56% per annum over the past five years. Earnings per share have grown rapidly, and the company is retaining a majority of its earnings. We think this is ideal from an investment perspective, if the company is able to reinvest these earnings effectively.
Conclusion
To summarise, shareholders should always check that Peabody Energy's dividends are affordable, that its dividend payments are relatively stable, and that it has decent prospects for growing its earnings and dividend. Firstly, we like that Peabody Energy has low and conservative payout ratios. Next, earnings growth has been good, but unfortunately the company has not been paying dividends as long as we'd like. Overall we think Peabody Energy scores well on our analysis. It's not quite perfect, but we'd definitely be keen to take a closer look.
Companies that are growing earnings tend to be the best dividend stocks over the long term. See what the 6 analysts we track are forecasting for Peabody Energy for free with public analyst estimates for the company.
If you are a dividend investor, you might also want to look at our curated list of dividend stocks yielding above 3%.
If you spot an error that warrants correction, please contact the editor at editorial-team@simplywallst.com. This article by Simply Wall St is general in nature. It does not constitute a recommendation to buy or sell any stock, and does not take account of your objectives, or your financial situation. Simply Wall St has no position in the stocks mentioned.
We aim to bring you long-term focused research analysis driven by fundamental data. Note that our analysis may not factor in the latest price-sensitive company announcements or qualitative material. Thank you for reading.
