
 Yahoo Finance
 Why Eland Oil & Gas PLC’s (LON:ELA) Return On Capital Employed Is Impressive

Want to participate in a research study? Help shape the future of investing tools and earn a $60 gift card!
Today we'll look at Eland Oil & Gas PLC (LON:ELA) and reflect on its potential as an investment. Specifically, we'll consider its Return On Capital Employed (ROCE), since that will give us an insight into how efficiently the business can generate profits from the capital it requires.
First up, we'll look at what ROCE is and how we calculate it. Second, we'll look at its ROCE compared to similar companies. Finally, we'll look at how its current liabilities affect its ROCE.
What is Return On Capital Employed (ROCE)?
ROCE is a metric for evaluating how much pre-tax income (in percentage terms) a company earns on the capital invested in its business. In general, businesses with a higher ROCE are usually better quality. Ultimately, it is a useful but imperfect metric. Author Edwin Whiting says to be careful when comparing the ROCE of different businesses, since 'No two businesses are exactly alike.'
How Do You Calculate Return On Capital Employed?
The formula for calculating the return on capital employed is:
Return on Capital Employed = Earnings Before Interest and Tax (EBIT) ÷ (Total Assets - Current Liabilities)
Or for Eland Oil & Gas:
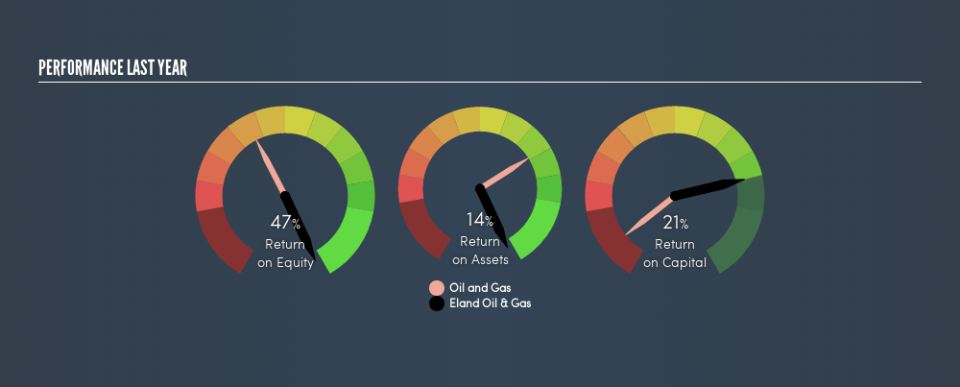
0.21 = US$79m ÷ (US$474m - US$101m) (Based on the trailing twelve months to December 2018.)
Therefore, Eland Oil & Gas has an ROCE of 21%.
See our latest analysis for Eland Oil & Gas
Is Eland Oil & Gas's ROCE Good?
ROCE is commonly used for comparing the performance of similar businesses. In our analysis, Eland Oil & Gas's ROCE is meaningfully higher than the 7.4% average in the Oil and Gas industry. We consider this a positive sign, because it suggests it uses capital more efficiently than similar companies. Setting aside the comparison to its industry for a moment, Eland Oil & Gas's ROCE in absolute terms currently looks quite high.
Eland Oil & Gas delivered an ROCE of 21%, which is better than 3 years ago, as was making losses back then. This makes us wonder if the company is improving.
When considering this metric, keep in mind that it is backwards looking, and not necessarily predictive. Companies in cyclical industries can be difficult to understand using ROCE, as returns typically look high during boom times, and low during busts. This is because ROCE only looks at one year, instead of considering returns across a whole cycle. Given the industry it operates in, Eland Oil & Gas could be considered cyclical. What happens in the future is pretty important for investors, so we have prepared a free report on analyst forecasts for Eland Oil & Gas.
Eland Oil & Gas's Current Liabilities And Their Impact On Its ROCE
Current liabilities are short term bills and invoices that need to be paid in 12 months or less. Due to the way the ROCE equation works, having large bills due in the near term can make it look as though a company has less capital employed, and thus a higher ROCE than usual. To counteract this, we check if a company has high current liabilities, relative to its total assets.
Eland Oil & Gas has total assets of US$474m and current liabilities of US$101m. Therefore its current liabilities are equivalent to approximately 21% of its total assets. This is quite a low level of current liabilities which would not greatly boost the already high ROCE.
Our Take On Eland Oil & Gas's ROCE
This is good to see, and with such a high ROCE, Eland Oil & Gas may be worth a closer look. But note: Eland Oil & Gas may not be the best stock to buy. So take a peek at this free list of interesting companies with strong recent earnings growth (and a P/E ratio below 20).
I will like Eland Oil & Gas better if I see some big insider buys. While we wait, check out this free list of growing companies with considerable, recent, insider buying.
We aim to bring you long-term focused research analysis driven by fundamental data. Note that our analysis may not factor in the latest price-sensitive company announcements or qualitative material.
If you spot an error that warrants correction, please contact the editor at editorial-team@simplywallst.com. This article by Simply Wall St is general in nature. It does not constitute a recommendation to buy or sell any stock, and does not take account of your objectives, or your financial situation. Simply Wall St has no position in the stocks mentioned. Thank you for reading.
