
 Yahoo Finance
 Why Frasers Group plc’s (LON:FRAS) Return On Capital Employed Looks Uninspiring

Today we'll evaluate Frasers Group plc (LON:FRAS) to determine whether it could have potential as an investment idea. To be precise, we'll consider its Return On Capital Employed (ROCE), as that will inform our view of the quality of the business.
Firstly, we'll go over how we calculate ROCE. Second, we'll look at its ROCE compared to similar companies. Then we'll determine how its current liabilities are affecting its ROCE.
What is Return On Capital Employed (ROCE)?
ROCE measures the 'return' (pre-tax profit) a company generates from capital employed in its business. All else being equal, a better business will have a higher ROCE. Ultimately, it is a useful but imperfect metric. Renowned investment researcher Michael Mauboussin has suggested that a high ROCE can indicate that 'one dollar invested in the company generates value of more than one dollar'.
How Do You Calculate Return On Capital Employed?
The formula for calculating the return on capital employed is:
Return on Capital Employed = Earnings Before Interest and Tax (EBIT) ÷ (Total Assets - Current Liabilities)
Or for Frasers Group:
0.068 = UK£184m ÷ (UK£3.7b - UK£960m) (Based on the trailing twelve months to October 2019.)
Therefore, Frasers Group has an ROCE of 6.8%.
See our latest analysis for Frasers Group
Does Frasers Group Have A Good ROCE?
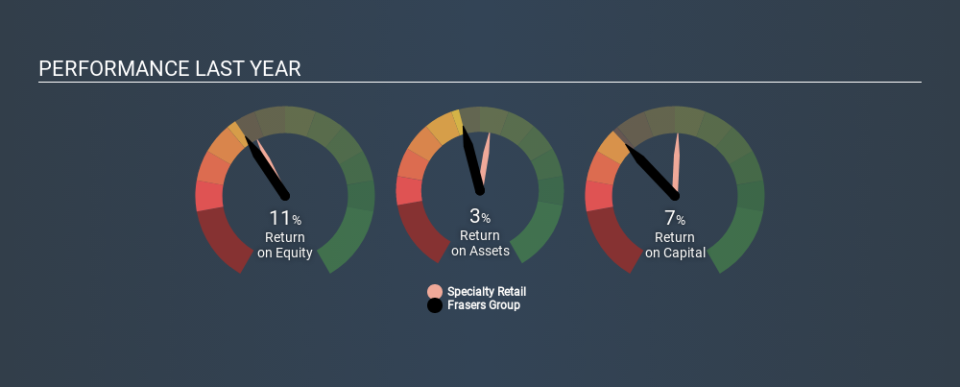
One way to assess ROCE is to compare similar companies. Using our data, Frasers Group's ROCE appears to be significantly below the 8.6% average in the Specialty Retail industry. This performance is not ideal, as it suggests the company may not be deploying its capital as effectively as some competitors. Aside from the industry comparison, Frasers Group's ROCE is mediocre in absolute terms, considering the risk of investing in stocks versus the safety of a bank account. Readers may find more attractive investment prospects elsewhere.
We can see that, Frasers Group currently has an ROCE of 6.8%, less than the 12% it reported 3 years ago. So investors might consider if it has had issues recently. You can see in the image below how Frasers Group's ROCE compares to its industry. Click to see more on past growth.
Remember that this metric is backwards looking - it shows what has happened in the past, and does not accurately predict the future. ROCE can be deceptive for cyclical businesses, as returns can look incredible in boom times, and terribly low in downturns. ROCE is, after all, simply a snap shot of a single year. Since the future is so important for investors, you should check out our free report on analyst forecasts for Frasers Group.
What Are Current Liabilities, And How Do They Affect Frasers Group's ROCE?
Current liabilities are short term bills and invoices that need to be paid in 12 months or less. The ROCE equation subtracts current liabilities from capital employed, so a company with a lot of current liabilities appears to have less capital employed, and a higher ROCE than otherwise. To check the impact of this, we calculate if a company has high current liabilities relative to its total assets.
Frasers Group has current liabilities of UK£960m and total assets of UK£3.7b. As a result, its current liabilities are equal to approximately 26% of its total assets. It is good to see a restrained amount of current liabilities, as this limits the effect on ROCE.
The Bottom Line On Frasers Group's ROCE
If Frasers Group continues to earn an uninspiring ROCE, there may be better places to invest. But note: make sure you look for a great company, not just the first idea you come across. So take a peek at this free list of interesting companies with strong recent earnings growth (and a P/E ratio below 20).
If you like to buy stocks alongside management, then you might just love this free list of companies. (Hint: insiders have been buying them).
If you spot an error that warrants correction, please contact the editor at editorial-team@simplywallst.com. This article by Simply Wall St is general in nature. It does not constitute a recommendation to buy or sell any stock, and does not take account of your objectives, or your financial situation. Simply Wall St has no position in the stocks mentioned.
We aim to bring you long-term focused research analysis driven by fundamental data. Note that our analysis may not factor in the latest price-sensitive company announcements or qualitative material. Thank you for reading.
