
 Yahoo Finance
 Why Is Freeport-McMoRan (FCX) Down 1.4% Since its Last Earnings Report?

It has been about a month since the last earnings report for Freeport-McMoRan Inc. FCX. Shares have lost about 1.4% in the past month, outperforming the market.
Will the recent negative trend continue leading up to its next earnings release, or is FCX due for a breakout? Before we dive into how investors and analysts have reacted as of late, let's take a quick look at its most recent earnings report in order to get a better handle on the important drivers.
Freeport Tops Earnings and Revenue Estimates in Q4
Freeport reported net income (attributable to common stock) of 71 cents per share for fourth-quarter 2017 compared with 21 cents recorded a year ago.
Barring one-time items, adjusted earnings came in at 51 cents a share in the quarter, beating the Zacks Consensus Estimate of 49 cents.
Revenues went up around 15.2% year over year to $5,041 million in the quarter under review, surpassing the Zacks Consensus Estimate of $4,811.2 million.
Consolidated sales from mines totaled 1 billion pounds of copper, 593,000 ounces of gold and 24 million pounds of molybdenum for the reported quarter. Copper sales volumes were lower than the year-ago figure of 1.1 billion, which mainly reflects lower sales volume at Cerro Verde and in North America. Gold sales also fell year over year mainly reflecting lower mill rates at PT Freeport Indonesia (PT-FI).
According to Freeport, during 2017 the company benefited from improved market conditions for copper, focus on productivity and cost and capital discipline.
Full-Year 2017
Freeport reported earnings of $1.25 per share for full-year 2017, as against loss of $3.16 per share reported year ago. Sales increased 10.6% year over year to $16,403 million in 2017.
Operational Update
Consolidated average unit net cash costs of $1.04 per pound of copper were lower from $1.21 reported in the year-ago quarter, mainly due to higher by-product credits, which were partly offset higher mining and milling costs and lower copper sales volumes in South America.
Average realized price for copper was $3.21 per pound, up from $2.48 a year ago. Average realized price per ounce for gold rose to $1,285 in the quarter from $1,174 a year ago, while average realized price per pound for molybdenum was $9.79 per pound.
Mining Update
North America Copper Mines: Copper sales decreased 14.9% year over year to 354 million pounds mainly due to expected lower ore grades. Production fell 12.6% year over year to 367 million pounds in the reported quarter.
Freeport expects copper sales from North America to be 1.5 billion pounds in 2018.
South America Mining: Copper sales of 312 million pounds decreased 13.1% from the year-ago quarter.
South America mining is anticipated to report sales of around 1.2 billion pounds of copper in 2018.
Indonesia Mining: Copper sales of 351 million pounds marginally fell from 352 million pounds the year-ago quarter.
Gold sales surged 45.6% to 584,000 ounces and production rose 32.5% year over year to 562,000 ounces in the quarter.
Sales from Indonesia mining are anticipated to be about 1.2 billion pounds of copper and 2.4 million ounces of gold for 2018, compared with 1 billion pounds of copper and 1.5 million ounces of gold for 2017.
Molybdenum Mines: Molybdenum production was 8 million pounds in the fourth-quarter 2017 compared with 7 million pounds in the year-ago quarter.
Financial Position
Freeport had operating cash flows totaled roughly $1.7 billion in the quarter, which includes $0.2 billion in working capital and changes in other tax payments.
Freeport had total debt of $13,117 million as of Dec 31, 2017, down from $16,027 million as of Dec 31, 2016.
Guidance
Freeport anticipates consolidated sales volumes for 2018 to be roughly 3.9 billion pounds of copper, 2.4 million ounces of gold and 91 million pounds of molybdenum, including 1 billion pounds of copper, 675,000 ounces of gold and 24 million pounds of molybdenum for first-quarter 2018.
For 2018, the company expects operating cash flows to exceed $5.8 billion (including $0.3 billion in working capital and other tax payments) and capital expenditures to be around $2.1 billion, which includes $1.2 billion for major mining projects mainly related to underground development in the Grasberg and the Lone Star oxide project.
Freeport had no borrowings with $3.5 billion available under its revolving credit facility at the end of 2017.
How Have Estimates Been Moving Since Then?
In the past month, investors have witnessed an upward trend in fresh estimates. There have been four revisions higher for the current quarter compared to one lower.
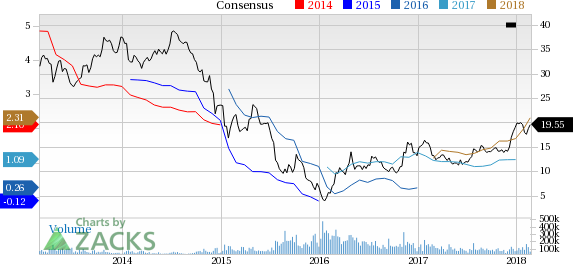
Freeport-McMoRan Inc. Price and Consensus
Freeport-McMoRan Inc. Price and Consensus | Freeport-McMoRan Inc. Quote
VGM Scores
At this time, FCX has a great Growth Score of A, though it is lagging a bit on the momentum front with a B. However, the stock was also allocated a grade of A on the value side, putting it in the top quintile for this investment strategy.
Overall, the stock has an aggregate VGM Score of A. If you aren't focused on one strategy, this score is the one you should be interested in.
Zacks' style scores indicate that the company's stock is more suitable for value and growth than momentum investors.
Outlook
Estimates have been broadly trending upward for the stock, and the magnitude of these revisions looks promising. Interestingly, FCX has a Zacks Rank #3 (Hold). We expect an in-line return from the stock in the next few months.
Want the latest recommendations from Zacks Investment Research? Today, you can download 7 Best Stocks for the Next 30 Days. Click to get this free report
Freeport-McMoRan Inc. (FCX) : Free Stock Analysis Report
To read this article on Zacks.com click here.
Zacks Investment Research
