
 Yahoo Finance
 Why Fuller, Smith & Turner P.L.C.'s (LON:FSTA) High P/E Ratio Isn't Necessarily A Bad Thing

This article is written for those who want to get better at using price to earnings ratios (P/E ratios). To keep it practical, we'll show how Fuller, Smith & Turner P.L.C.'s (LON:FSTA) P/E ratio could help you assess the value on offer. Based on the last twelve months, Fuller Smith & Turner's P/E ratio is 36.58. In other words, at today's prices, investors are paying £36.58 for every £1 in prior year profit.
View our latest analysis for Fuller Smith & Turner
How Do You Calculate A P/E Ratio?
The formula for P/E is:
Price to Earnings Ratio = Price per Share ÷ Earnings per Share (EPS)
Or for Fuller Smith & Turner:
P/E of 36.58 = £10.25 ÷ £0.28 (Based on the trailing twelve months to March 2019.)
Is A High Price-to-Earnings Ratio Good?
The higher the P/E ratio, the higher the price tag of a business, relative to its trailing earnings. That isn't necessarily good or bad, but a high P/E implies relatively high expectations of what a company can achieve in the future.
Does Fuller Smith & Turner Have A Relatively High Or Low P/E For Its Industry?
The P/E ratio indicates whether the market has higher or lower expectations of a company. The image below shows that Fuller Smith & Turner has a higher P/E than the average (24.8) P/E for companies in the hospitality industry.
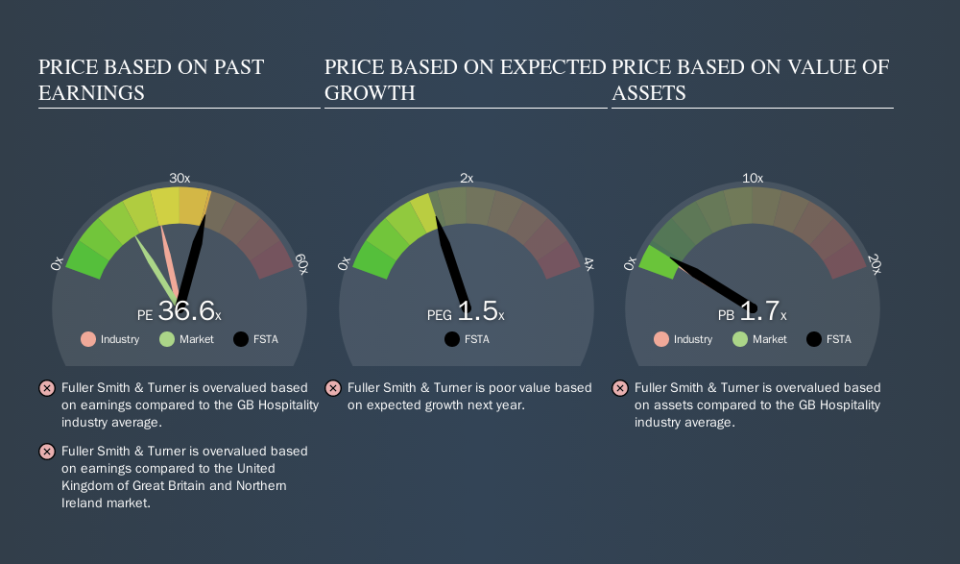
Fuller Smith & Turner's P/E tells us that market participants think the company will perform better than its industry peers, going forward. The market is optimistic about the future, but that doesn't guarantee future growth. So investors should always consider the P/E ratio alongside other factors, such as whether company directors have been buying shares.
How Growth Rates Impact P/E Ratios
Companies that shrink earnings per share quickly will rapidly decrease the 'E' in the equation. That means unless the share price falls, the P/E will increase in a few years. A higher P/E should indicate the stock is expensive relative to others -- and that may encourage shareholders to sell.
Fuller Smith & Turner saw earnings per share decrease by 48% last year. And it has shrunk its earnings per share by 12% per year over the last five years. This might lead to muted expectations.
Remember: P/E Ratios Don't Consider The Balance Sheet
One drawback of using a P/E ratio is that it considers market capitalization, but not the balance sheet. That means it doesn't take debt or cash into account. The exact same company would hypothetically deserve a higher P/E ratio if it had a strong balance sheet, than if it had a weak one with lots of debt, because a cashed up company can spend on growth.
Such spending might be good or bad, overall, but the key point here is that you need to look at debt to understand the P/E ratio in context.
So What Does Fuller Smith & Turner's Balance Sheet Tell Us?
Fuller Smith & Turner has net debt equal to 44% of its market cap. You'd want to be aware of this fact, but it doesn't bother us.
The Verdict On Fuller Smith & Turner's P/E Ratio
Fuller Smith & Turner's P/E is 36.6 which is above average (16.7) in its market. With modest debt but no EPS growth in the last year, it's fair to say the P/E implies some optimism about future earnings, from the market.
Investors have an opportunity when market expectations about a stock are wrong. People often underestimate remarkable growth -- so investors can make money when fast growth is not fully appreciated. So this free report on the analyst consensus forecasts could help you make a master move on this stock.
You might be able to find a better buy than Fuller Smith & Turner. If you want a selection of possible winners, check out this free list of interesting companies that trade on a P/E below 20 (but have proven they can grow earnings).
We aim to bring you long-term focused research analysis driven by fundamental data. Note that our analysis may not factor in the latest price-sensitive company announcements or qualitative material.
If you spot an error that warrants correction, please contact the editor at editorial-team@simplywallst.com. This article by Simply Wall St is general in nature. It does not constitute a recommendation to buy or sell any stock, and does not take account of your objectives, or your financial situation. Simply Wall St has no position in the stocks mentioned. Thank you for reading.
