
 Yahoo Finance
 Why The Gap Inc (NYSE:GPS) Should Be In Your Portfolio

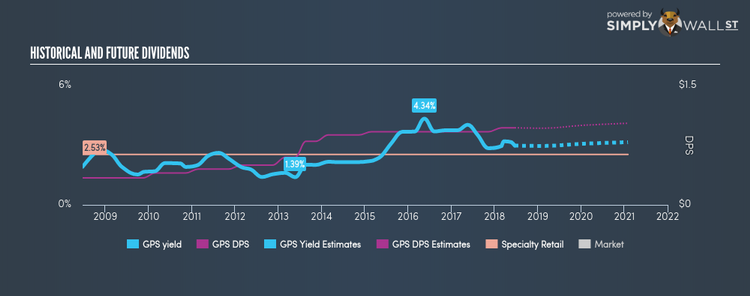
Over the past 10 years The Gap Inc (NYSE:GPS) has returned an average of 3.00% per year from dividend payouts. The stock currently pays out a dividend yield of 2.98%, and has a market cap of US$12.26B. Let’s dig deeper into whether Gap should have a place in your portfolio. Check out our latest analysis for Gap
5 checks you should use to assess a dividend stock
Whenever I am looking at a potential dividend stock investment, I always check these five metrics:
Does it pay an annual yield higher than 75% of dividend payers?
Has it consistently paid a stable dividend without missing a payment or drastically cutting payout?
Has it increased its dividend per share amount over the past?
Is it able to pay the current rate of dividends from its earnings?
Based on future earnings growth, will it be able to continue to payout dividend at the current rate?
How does Gap fare?
The current trailing twelve-month payout ratio for the stock is 41.90%, meaning the dividend is sufficiently covered by earnings. In the near future, analysts are predicting lower payout ratio of 37.55%, leading to a dividend yield of 3.04%. However, EPS should increase to $2.63, meaning that the lower payout ratio does not necessarily implicate a lower dividend payment. If dividend is a key criteria in your investment consideration, then you need to make sure the dividend stock you’re eyeing out is reliable in its payments. GPS has increased its DPS from $0.34 to $0.97 in the past 10 years. During this period it has not missed a payment, as one would expect for a company increasing its dividend. These are all positive signs of a great, reliable dividend stock. In terms of its peers, Gap has a yield of 2.98%, which is high for Specialty Retail stocks but still below the market’s top dividend payers.
Next Steps:
With this in mind, I definitely rank Gap as a strong dividend stock, and makes it worth further research for anyone who likes steady income generation from their portfolio. Given that this is purely a dividend analysis, I urge potential investors to try and get a good understanding of the underlying business and its fundamentals before deciding on an investment. There are three essential aspects you should further research:
Future Outlook: What are well-informed industry analysts predicting for GPS’s future growth? Take a look at our free research report of analyst consensus for GPS’s outlook.
Valuation: What is GPS worth today? Even if the stock is a cash cow, it’s not worth an infinite price. The intrinsic value infographic in our free research report helps visualize whether GPS is currently mispriced by the market.
Other Dividend Rockstars: Are there better dividend payers with stronger fundamentals out there? Check out our free list of these great stocks here.
To help readers see pass the short term volatility of the financial market, we aim to bring you a long-term focused research analysis purely driven by fundamental data. Note that our analysis does not factor in the latest price sensitive company announcements.
The author is an independent contributor and at the time of publication had no position in the stocks mentioned.
