
 Yahoo Finance
 Why Grainger plc’s (LON:GRI) High P/E Ratio Isn’t Necessarily A Bad Thing

Want to participate in a short research study? Help shape the future of investing tools and you could win a $250 gift card!
This article is for investors who would like to improve their understanding of price to earnings ratios (P/E ratios). To keep it practical, we’ll show how Grainger plc’s (LON:GRI) P/E ratio could help you assess the value on offer. Based on the last twelve months, Grainger’s P/E ratio is 11.22. That is equivalent to an earnings yield of about 8.9%.
Check out our latest analysis for Grainger
How Do I Calculate A Price To Earnings Ratio?
The formula for price to earnings is:
Price to Earnings Ratio = Price per Share ÷ Earnings per Share (EPS)
Or for Grainger:
P/E of 11.22 = £2.36 ÷ £0.21 (Based on the year to September 2018.)
Is A High Price-to-Earnings Ratio Good?
A higher P/E ratio implies that investors pay a higher price for the earning power of the business. That isn’t a good or a bad thing on its own, but a high P/E means that buyers have a higher opinion of the business’s prospects, relative to stocks with a lower P/E.
How Growth Rates Impact P/E Ratios
P/E ratios primarily reflect market expectations around earnings growth rates. When earnings grow, the ‘E’ increases, over time. Therefore, even if you pay a high multiple of earnings now, that multiple will become lower in the future. A lower P/E should indicate the stock is cheap relative to others — and that may attract buyers.
It’s great to see that Grainger grew EPS by 19% in the last year. And earnings per share have improved by 5.1% annually, over the last five years. This could arguably justify a relatively high P/E ratio.
How Does Grainger’s P/E Ratio Compare To Its Peers?
The P/E ratio indicates whether the market has higher or lower expectations of a company. As you can see below, Grainger has a higher P/E than the average company (9.1) in the real estate industry.
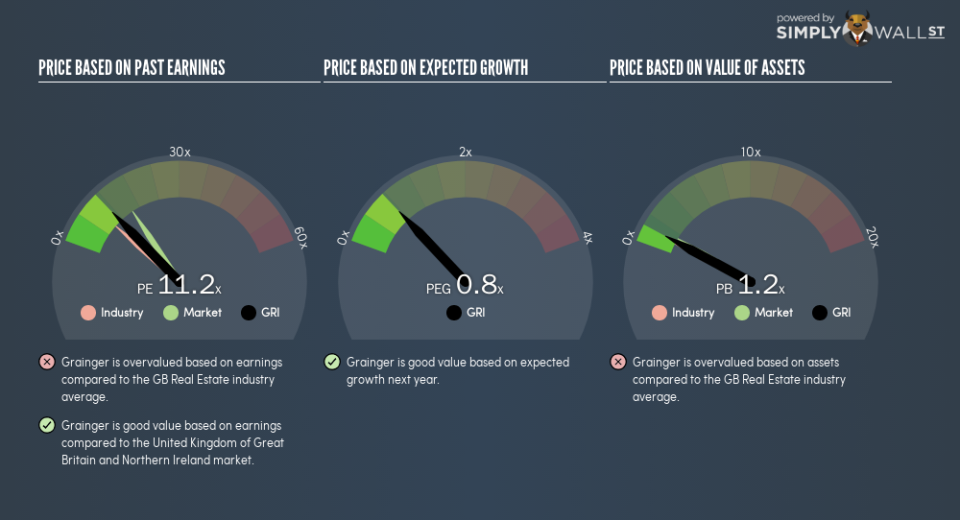
That means that the market expects Grainger will outperform other companies in its industry. Clearly the market expects growth, but it isn’t guaranteed. So further research is always essential. I often monitor director buying and selling.
Remember: P/E Ratios Don’t Consider The Balance Sheet
Don’t forget that the P/E ratio considers market capitalization. In other words, it does not consider any debt or cash that the company may have on the balance sheet. In theory, a company can lower its future P/E ratio by using cash or debt to invest in growth.
Spending on growth might be good or bad a few years later, but the point is that the P/E ratio does not account for the option (or lack thereof).
Is Debt Impacting Grainger’s P/E?
Grainger has net debt worth 59% of its market capitalization. This is a reasonably significant level of debt — all else being equal you’d expect a much lower P/E than if it had net cash.
The Bottom Line On Grainger’s P/E Ratio
Grainger has a P/E of 11.2. That’s below the average in the GB market, which is 15.6. While the EPS growth last year was strong, the significant debt levels reduce the number of options available to management. If the company can continue to grow earnings, then the current P/E may be unjustifiably low.
When the market is wrong about a stock, it gives savvy investors an opportunity. If the reality for a company is not as bad as the P/E ratio indicates, then the share price should increase as the market realizes this. So this free visual report on analyst forecasts could hold they key to an excellent investment decision.
You might be able to find a better buy than Grainger. If you want a selection of possible winners, check out this free list of interesting companies that trade on a P/E below 20 (but have proven they can grow earnings).
To help readers see past the short term volatility of the financial market, we aim to bring you a long-term focused research analysis purely driven by fundamental data. Note that our analysis does not factor in the latest price-sensitive company announcements.
The author is an independent contributor and at the time of publication had no position in the stocks mentioned. For errors that warrant correction please contact the editor at editorial-team@simplywallst.com.
