
 Yahoo Finance
 Why Is Hain Celestial (HAIN) Down 1.8% Since its Last Earnings Report?

It has been about a month since the last earnings report for The Hain Celestial Group, Inc. HAIN. Shares have lost about 1.8% in that time frame.
Will the recent negative trend continue leading up to its next earnings release, or is HAIN due for a breakout? Before we dive into how investors and analysts have reacted as of late, let's take a quick look at the most recent earnings report in order to get a better handle on the important drivers.
Hain Celestial Earnings & Sales Miss Estimates in Q3
The Hain Celestial Group wrapped up third-quarter fiscal 2018 on a dismal note. Marking the second straight quarter of a miss, both earnings and sales lagged estimates but improved year over year.
The company reported adjusted earnings per share of 37 cents, missing the Zacks Consensus Estimate of 47 cents. However, bottom-line results improved 5.7% year over year.
Net sales from continuing operations, excluding Hain Pure Protein, increased 8% year over year to $632.7 million, missing the Zacks Consensus Estimate of $751.8 million. The rise in sales can primarily be attributable to mid- to high single-digit increase in the United Kingdom and Rest of World, including the Canada and Europe operating segments. This was partially negated by low-single-digit decline in the United States. The company’s sales increased 2% on a constant currency basis.
Let’s Delve Deep
In the reported quarter, net sales at the United States segment dropped 3% year over year to $281.1 million. Net sales in United Kingdom and Rest of the World segments rose 19% and 15%, respectively, to $238.3 million and $113.3 million.
The company also announced that the divestment of Hain Pure Protein business is expected to close in the first half of fiscal 2019.
Gross profits were down 4.4% year over year to $133 million. Adjusted operating income dropped 4.9% to $56 million, while adjusted operating margin contracted 110 basis points to 8.9%.
Other Financials
The company ended the quarter with cash and cash equivalents of $117.2 million, long-term debt (excluding current maturities) of nearly $723.5 million and shareholders’ equity of $1,875.8 million. Cash flow from operating activities totaled $39 million in the quarter, compared with $44.8 million in the prior-year quarter. Capital expenditures were roughly $23.7 million. The company generated operating free cash flow of $15.3 million in third-quarter fiscal 2018, compared with $31.9 million in the prior-year quarter.
Outlook
Hain Celestial is committed to its four-point strategic plan. The strategies include investment in top brands and grow globally; delivering on Terra cost savings and productivity; enhancing leadership to deliver on strategic goals; and returning value to shareholders.
Following the third-quarter results, the company adjusted guidance ranges for EBITDA and earnings per share for fiscal 2018, while reiterating net sales projections. For fiscal 2018, the company expects net sales between $2.43 billion and $2.50 billion. Net sales in the United States is expected to remain flat or decline slightly. Meanwhile, United Kingdom and the Rest of World segments are projected to witness growth of high-single digits to low-double digits, compared with the prior estimate of low to mid-single-digit.
Adjusted EBITDA is now projected in the range of $250-$260 million versus the previous $292 million to $307 million.
Cash flow from operation is anticipated in the range of $105-$125 million, the earlier band being $200-$235 million. Meanwhile, management continues to anticipate capital expenditure of approximately $75 million for fiscal 2018.
This company now projects adjusted earnings per share in the range of $1.11-$1.18, compared with the earlier view of $1.39-$1.50, including 8-9 cents of gain from the latest tax reform. The Zacks Consensus Estimate of $1.66 is way above the company’s guided range and is likely to move south in the coming days.
How Have Estimates Been Moving Since Then?
In the past month, investors have witnessed a downward trend in fresh estimates. There have been six revisions lower for the current quarter. Last month, the consensus estimate has shifted downward by 53% due to these changes.
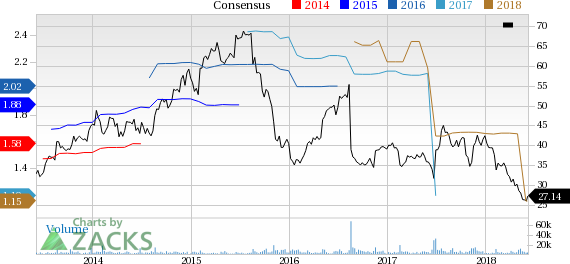
The Hain Celestial Group, Inc. Price and Consensus
The Hain Celestial Group, Inc. Price and Consensus | The Hain Celestial Group, Inc. Quote
VGM Scores
At this time, HAIN has a nice Growth Score of B, though it is lagging a lot on the momentum front with a D. The stock was allocated a grade of C on the value side, putting it in the middle 20% for this investment strategy.
Overall, the stock has an aggregate VGM Score of C. If you aren't focused on one strategy, this score is the one you should be interested in.
Our style scores indicate that the stock is more suitable for growth investors than value investors.
Outlook
Estimates have been broadly trending downward for the stock and the magnitude of these revisions indicates a downward shift. It's no surprise HAIN has a Zacks Rank #5 (Strong Sell). We expect a below average return from the stock in the next few months.
Want the latest recommendations from Zacks Investment Research? Today, you can download 7 Best Stocks for the Next 30 Days. Click to get this free report
The Hain Celestial Group, Inc. (HAIN) : Free Stock Analysis Report
To read this article on Zacks.com click here.
Zacks Investment Research
