
 Yahoo Finance
 Why Investors Shouldn't Be Surprised By Enerpac Tool Group Corp.'s (NYSE:EPAC) P/E
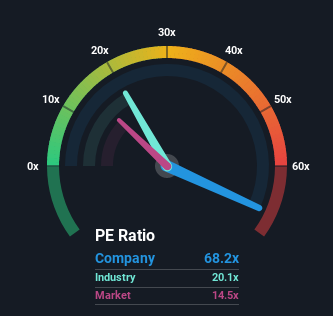
Enerpac Tool Group Corp.'s (NYSE:EPAC) price-to-earnings (or "P/E") ratio of 68.2x might make it look like a strong sell right now compared to the market in the United States, where around half of the companies have P/E ratios below 14x and even P/E's below 8x are quite common. Nonetheless, we'd need to dig a little deeper to determine if there is a rational basis for the highly elevated P/E.
Enerpac Tool Group hasn't been tracking well recently as its declining earnings compare poorly to other companies, which have seen some growth on average. It might be that many expect the dour earnings performance to recover substantially, which has kept the P/E from collapsing. If not, then existing shareholders may be extremely nervous about the viability of the share price.
See our latest analysis for Enerpac Tool Group
Keen to find out how analysts think Enerpac Tool Group's future stacks up against the industry? In that case, our free report is a great place to start.
How Is Enerpac Tool Group's Growth Trending?
In order to justify its P/E ratio, Enerpac Tool Group would need to produce outstanding growth well in excess of the market.
If we review the last year of earnings, dishearteningly the company's profits fell to the tune of 53%. Unfortunately, that's brought it right back to where it started three years ago with EPS growth being virtually non-existent overall during that time. Accordingly, shareholders probably wouldn't have been overly satisfied with the unstable medium-term growth rates.
Turning to the outlook, the next year should generate growth of 238% as estimated by the three analysts watching the company. That's shaping up to be materially higher than the 10% growth forecast for the broader market.
With this information, we can see why Enerpac Tool Group is trading at such a high P/E compared to the market. Apparently shareholders aren't keen to offload something that is potentially eyeing a more prosperous future.
The Final Word
It's argued the price-to-earnings ratio is an inferior measure of value within certain industries, but it can be a powerful business sentiment indicator.
As we suspected, our examination of Enerpac Tool Group's analyst forecasts revealed that its superior earnings outlook is contributing to its high P/E. At this stage investors feel the potential for a deterioration in earnings isn't great enough to justify a lower P/E ratio. Unless these conditions change, they will continue to provide strong support to the share price.
It's always necessary to consider the ever-present spectre of investment risk. We've identified 2 warning signs with Enerpac Tool Group, and understanding them should be part of your investment process.
Of course, you might find a fantastic investment by looking at a few good candidates. So take a peek at this free list of companies with a strong growth track record, trading on a P/E below 20x.
Have feedback on this article? Concerned about the content? Get in touch with us directly. Alternatively, email editorial-team (at) simplywallst.com.
This article by Simply Wall St is general in nature. We provide commentary based on historical data and analyst forecasts only using an unbiased methodology and our articles are not intended to be financial advice. It does not constitute a recommendation to buy or sell any stock, and does not take account of your objectives, or your financial situation. We aim to bring you long-term focused analysis driven by fundamental data. Note that our analysis may not factor in the latest price-sensitive company announcements or qualitative material. Simply Wall St has no position in any stocks mentioned.
