
 Yahoo Finance
 Why Investors Shouldn't Be Surprised By Omni-Lite Industries Canada Inc.'s (CVE:OML) Low P/S
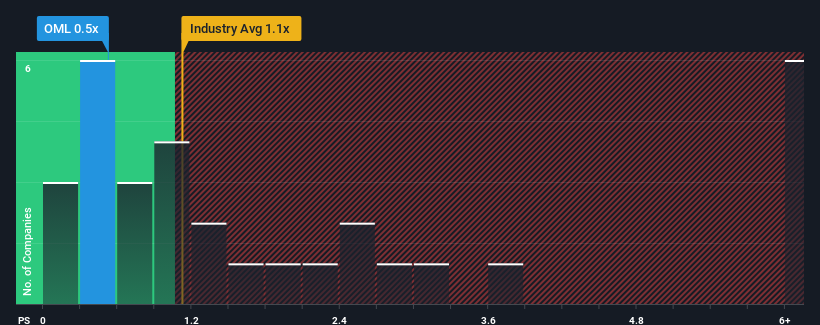
Omni-Lite Industries Canada Inc.'s (CVE:OML) price-to-sales (or "P/S") ratio of 0.5x may look like a pretty appealing investment opportunity when you consider close to half the companies in the Machinery industry in Canada have P/S ratios greater than 1.1x. However, the P/S might be low for a reason and it requires further investigation to determine if it's justified.
View our latest analysis for Omni-Lite Industries Canada
How Omni-Lite Industries Canada Has Been Performing
Recent times have been quite advantageous for Omni-Lite Industries Canada as its revenue has been rising very briskly. It might be that many expect the strong revenue performance to degrade substantially, which has repressed the P/S ratio. If you like the company, you'd be hoping this isn't the case so that you could potentially pick up some stock while it's out of favour.
We don't have analyst forecasts, but you can see how recent trends are setting up the company for the future by checking out our free report on Omni-Lite Industries Canada's earnings, revenue and cash flow.
What Are Revenue Growth Metrics Telling Us About The Low P/S?
Omni-Lite Industries Canada's P/S ratio would be typical for a company that's only expected to deliver limited growth, and importantly, perform worse than the industry.
Taking a look back first, we see that the company grew revenue by an impressive 48% last year. The latest three year period has also seen an excellent 50% overall rise in revenue, aided by its short-term performance. Accordingly, shareholders would have definitely welcomed those medium-term rates of revenue growth.
Comparing the recent medium-term revenue trends against the industry's one-year growth forecast of 25% shows it's noticeably less attractive.
With this information, we can see why Omni-Lite Industries Canada is trading at a P/S lower than the industry. It seems most investors are expecting to see the recent limited growth rates continue into the future and are only willing to pay a reduced amount for the stock.
The Final Word
We'd say the price-to-sales ratio's power isn't primarily as a valuation instrument but rather to gauge current investor sentiment and future expectations.
Our examination of Omni-Lite Industries Canada confirms that the company's revenue trends over the past three-year years are a key factor in its low price-to-sales ratio, as we suspected, given they fall short of current industry expectations. At this stage investors feel the potential for an improvement in revenue isn't great enough to justify a higher P/S ratio. Unless the recent medium-term conditions improve, they will continue to form a barrier for the share price around these levels.
Before you settle on your opinion, we've discovered 2 warning signs for Omni-Lite Industries Canada that you should be aware of.
Of course, profitable companies with a history of great earnings growth are generally safer bets. So you may wish to see this free collection of other companies that have reasonable P/E ratios and have grown earnings strongly.
Have feedback on this article? Concerned about the content? Get in touch with us directly. Alternatively, email editorial-team (at) simplywallst.com.
This article by Simply Wall St is general in nature. We provide commentary based on historical data and analyst forecasts only using an unbiased methodology and our articles are not intended to be financial advice. It does not constitute a recommendation to buy or sell any stock, and does not take account of your objectives, or your financial situation. We aim to bring you long-term focused analysis driven by fundamental data. Note that our analysis may not factor in the latest price-sensitive company announcements or qualitative material. Simply Wall St has no position in any stocks mentioned.
