
 Yahoo Finance
 Why Investors Shouldn't Be Surprised By Phreesia, Inc.'s (NYSE:PHR) P/S
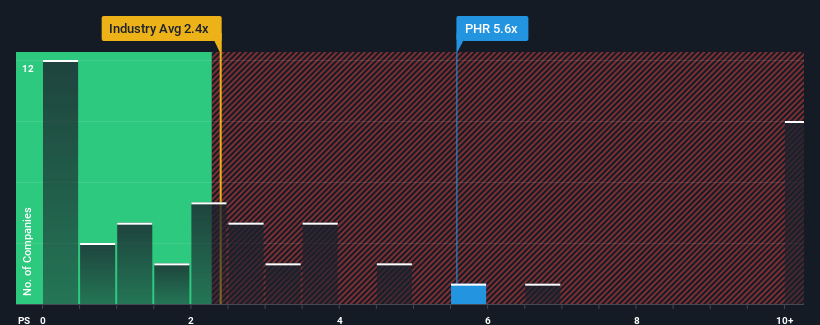
Phreesia, Inc.'s (NYSE:PHR) price-to-sales (or "P/S") ratio of 5.6x may look like a poor investment opportunity when you consider close to half the companies in the Healthcare Services industry in the United States have P/S ratios below 2.4x. Although, it's not wise to just take the P/S at face value as there may be an explanation why it's so lofty.
Check out our latest analysis for Phreesia
How Has Phreesia Performed Recently?
Phreesia certainly has been doing a good job lately as it's been growing revenue more than most other companies. The P/S is probably high because investors think this strong revenue performance will continue. However, if this isn't the case, investors might get caught out paying too much for the stock.
If you'd like to see what analysts are forecasting going forward, you should check out our free report on Phreesia.
Is There Enough Revenue Growth Forecasted For Phreesia?
In order to justify its P/S ratio, Phreesia would need to produce outstanding growth that's well in excess of the industry.
Taking a look back first, we see that the company grew revenue by an impressive 32% last year. Pleasingly, revenue has also lifted 125% in aggregate from three years ago, thanks to the last 12 months of growth. Therefore, it's fair to say the revenue growth recently has been superb for the company.
Looking ahead now, revenue is anticipated to climb by 26% each year during the coming three years according to the analysts following the company. Meanwhile, the rest of the industry is forecast to only expand by 18% each year, which is noticeably less attractive.
With this in mind, it's not hard to understand why Phreesia's P/S is high relative to its industry peers. Apparently shareholders aren't keen to offload something that is potentially eyeing a more prosperous future.
The Final Word
Typically, we'd caution against reading too much into price-to-sales ratios when settling on investment decisions, though it can reveal plenty about what other market participants think about the company.
We've established that Phreesia maintains its high P/S on the strength of its forecasted revenue growth being higher than the the rest of the Healthcare Services industry, as expected. At this stage investors feel the potential for a deterioration in revenues is quite remote, justifying the elevated P/S ratio. It's hard to see the share price falling strongly in the near future under these circumstances.
Don't forget that there may be other risks. For instance, we've identified 1 warning sign for Phreesia that you should be aware of.
Of course, profitable companies with a history of great earnings growth are generally safer bets. So you may wish to see this free collection of other companies that have reasonable P/E ratios and have grown earnings strongly.
Have feedback on this article? Concerned about the content? Get in touch with us directly. Alternatively, email editorial-team (at) simplywallst.com.
This article by Simply Wall St is general in nature. We provide commentary based on historical data and analyst forecasts only using an unbiased methodology and our articles are not intended to be financial advice. It does not constitute a recommendation to buy or sell any stock, and does not take account of your objectives, or your financial situation. We aim to bring you long-term focused analysis driven by fundamental data. Note that our analysis may not factor in the latest price-sensitive company announcements or qualitative material. Simply Wall St has no position in any stocks mentioned.
Join A Paid User Research Session
You’ll receive a US$30 Amazon Gift card for 1 hour of your time while helping us build better investing tools for the individual investors like yourself. Sign up here
