
 Yahoo Finance
 Why Investors Shouldn't Be Surprised By ScS Group plc's (LON:SCS) Low P/E

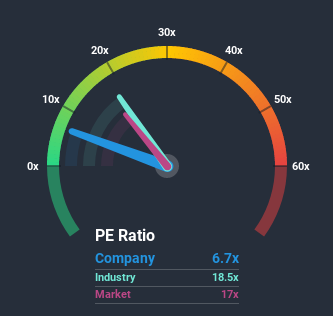
With a price-to-earnings (or "P/E") ratio of 6.7x ScS Group plc (LON:SCS) may be sending very bullish signals at the moment, given that almost half of all companies in the United Kingdom have P/E ratios greater than 17x and even P/E's higher than 35x are not unusual. Nonetheless, we'd need to dig a little deeper to determine if there is a rational basis for the highly reduced P/E.
ScS Group's negative earnings growth of late has neither been better nor worse than most other companies. One possibility is that the P/E is low because investors think the company's earnings may begin to slide even faster. If you still like the company, you'd want its earnings trajectory to turn around before making any decisions. At the very least, you'd be hoping that earnings don't fall off a cliff if your plan is to pick up some stock while it's out of favour.
See our latest analysis for ScS Group
If you'd like to see what analysts are forecasting going forward, you should check out our free report on ScS Group.
How Is ScS Group's Growth Trending?
ScS Group's P/E ratio would be typical for a company that's expected to deliver very poor growth or even falling earnings, and importantly, perform much worse than the market.
If we review the last year of earnings, dishearteningly the company's profits fell to the tune of 4.3%. Regardless, EPS has managed to lift by a handy 14% in aggregate from three years ago, thanks to the earlier period of growth. So we can start by confirming that the company has generally done a good job of growing earnings over that time, even though it had some hiccups along the way.
Turning to the outlook, the next three years should bring diminished returns, with earnings decreasing 21% each year as estimated by the three analysts watching the company. That's not great when the rest of the market is expected to grow by 12% per annum.
In light of this, it's understandable that ScS Group's P/E would sit below the majority of other companies. Nonetheless, there's no guarantee the P/E has reached a floor yet with earnings going in reverse. Even just maintaining these prices could be difficult to achieve as the weak outlook is weighing down the shares.
The Bottom Line On ScS Group's P/E
Generally, our preference is to limit the use of the price-to-earnings ratio to establishing what the market thinks about the overall health of a company.
We've established that ScS Group maintains its low P/E on the weakness of its forecast for sliding earnings, as expected. At this stage investors feel the potential for an improvement in earnings isn't great enough to justify a higher P/E ratio. It's hard to see the share price rising strongly in the near future under these circumstances.
Having said that, be aware ScS Group is showing 3 warning signs in our investment analysis, and 1 of those can't be ignored.
It's important to make sure you look for a great company, not just the first idea you come across. So take a peek at this free list of interesting companies with strong recent earnings growth (and a P/E ratio below 20x).
This article by Simply Wall St is general in nature. It does not constitute a recommendation to buy or sell any stock, and does not take account of your objectives, or your financial situation. We aim to bring you long-term focused analysis driven by fundamental data. Note that our analysis may not factor in the latest price-sensitive company announcements or qualitative material. Simply Wall St has no position in any stocks mentioned.
Have feedback on this article? Concerned about the content? Get in touch with us directly. Alternatively, email editorial-team@simplywallst.com.
