
 Yahoo Finance
 Why You Need To Look At This Factor Before Buying PhotonStar LED Group PLC (LON:PSL)

If you are looking to invest in PhotonStar LED Group PLC’s (AIM:PSL), or currently own the stock, then you need to understand its beta in order to understand how it can affect the risk of your portfolio. Every stock in the market is exposed to market risk, which arises from macroeconomic factors such as economic growth and geo-political tussles just to name a few. This is measured by its beta. Not every stock is exposed to the same level of market risk, and the market as a whole represents a beta value of one. Any stock with a beta of greater than one is considered more volatile than the market, and those with a beta less than one is generally less volatile.
Check out our latest analysis for PhotonStar LED Group
An interpretation of PSL’s beta
With a beta of 1.01, PhotonStar LED Group is a stock that tends to experience more gains than the market during a growth phase and also a bigger reduction in value compared to the market during a broad downturn. According to this value of beta, PSL will help diversify your portfolio, if it currently comprises of low-beta stocks. This will be beneficial for portfolio returns, in particular, when current market sentiment is positive.
How does PSL’s size and industry impact its risk?
With a market cap of UK£2.53M, PSL falls within the small-cap spectrum of stocks, which are found to experience higher relative risk compared to larger companies. Furthermore, the company operates in the electrical industry, which has been found to have high sensitivity to market-wide shocks. So, investors should expect a larger beta for smaller companies operating in a cyclical industry in contrast with lower beta for larger firms in a more defensive industry. This supports our interpretation of PSL’s beta value discussed above. Fundamental factors can also drive the cyclicality of the stock, which we will take a look at next.
Is PSL’s cost structure indicative of a high beta?
An asset-heavy company tends to have a higher beta because the risk associated with running fixed assets during a downturn is highly expensive. I test PSL’s ratio of fixed assets to total assets in order to determine how high the risk is associated with this type of constraint. Given that fixed assets make up less than a third of the company’s total assets, PSL doesn’t rely heavily upon these expensive, inflexible assets to run its business during downturns. As a result, the company may be less volatile relative to broad market movements, compared to a company of similar size but higher proportion of fixed assets. However, this is the opposite to what PSL’s actual beta value suggests, which is higher stock volatility relative to the market.
What this means for you:
You may reap the gains of PSL’s returns during times of economic growth by holding the stock. Its low fixed cost also implies that it has the flexibility to adjust its cost to preserve margins during times of a downturn. I recommend analysing the stock in terms of your current portfolio composition before deciding to invest more into PSL. What I have not mentioned in my article here are important company-specific fundamentals such as PhotonStar LED Group’s financial health and performance track record. I highly recommend you to complete your research by taking a look at the following:
Financial Health: Is PSL’s operations financially sustainable? Balance sheets can be hard to analyze, which is why we’ve done it for you. Check out our financial health checks here.
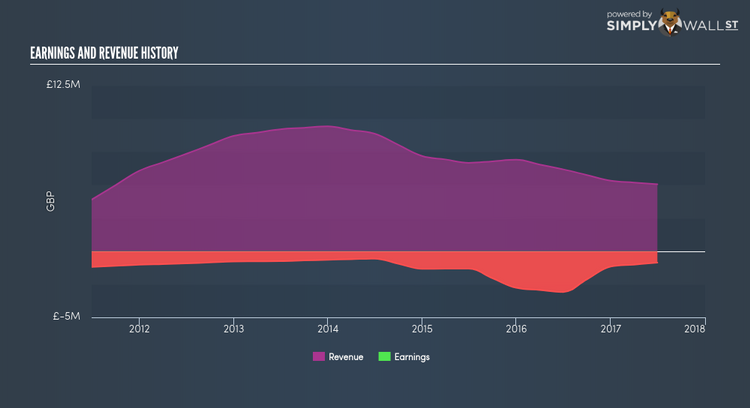
Past Track Record: Has PSL been consistently performing well irrespective of the ups and downs in the market? Go into more detail in the past performance analysis and take a look at the free visual representations of PSL’s historicals for more clarity.
Other High-Performing Stocks: Are there other stocks that provide better prospects with proven track records? Explore our free list of these great stocks here.
To help readers see pass the short term volatility of the financial market, we aim to bring you a long-term focused research analysis purely driven by fundamental data. Note that our analysis does not factor in the latest price sensitive company announcements.
The author is an independent contributor and at the time of publication had no position in the stocks mentioned.
