
 Yahoo Finance
 Why MarketAxess Holdings Inc.'s (NASDAQ:MKTX) High P/E Ratio Isn't Necessarily A Bad Thing

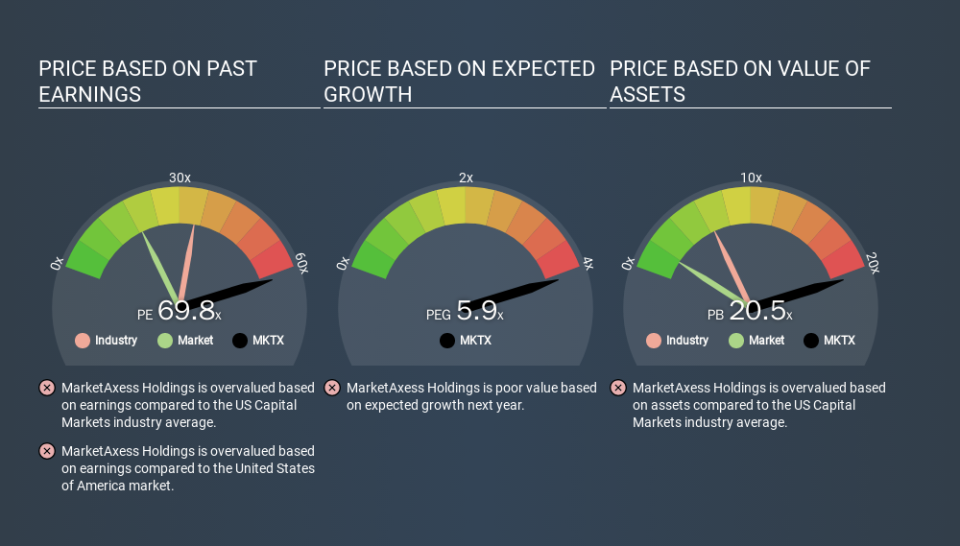
The goal of this article is to teach you how to use price to earnings ratios (P/E ratios). We'll apply a basic P/E ratio analysis to MarketAxess Holdings Inc.'s (NASDAQ:MKTX), to help you decide if the stock is worth further research. Based on the last twelve months, MarketAxess Holdings's P/E ratio is 69.75. That is equivalent to an earnings yield of about 1.4%.
View our latest analysis for MarketAxess Holdings
How Do I Calculate MarketAxess Holdings's Price To Earnings Ratio?
The formula for price to earnings is:
Price to Earnings Ratio = Price per Share ÷ Earnings per Share (EPS)
Or for MarketAxess Holdings:
P/E of 69.75 = $377.57 ÷ $5.41 (Based on the year to September 2019.)
Is A High P/E Ratio Good?
The higher the P/E ratio, the higher the price tag of a business, relative to its trailing earnings. All else being equal, it's better to pay a low price -- but as Warren Buffett said, 'It's far better to buy a wonderful company at a fair price than a fair company at a wonderful price'.
How Does MarketAxess Holdings's P/E Ratio Compare To Its Peers?
We can get an indication of market expectations by looking at the P/E ratio. As you can see below, MarketAxess Holdings has a higher P/E than the average company (34.5) in the capital markets industry.
MarketAxess Holdings's P/E tells us that market participants think the company will perform better than its industry peers, going forward. The market is optimistic about the future, but that doesn't guarantee future growth. So investors should delve deeper. I like to check if company insiders have been buying or selling.
How Growth Rates Impact P/E Ratios
Generally speaking the rate of earnings growth has a profound impact on a company's P/E multiple. That's because companies that grow earnings per share quickly will rapidly increase the 'E' in the equation. And in that case, the P/E ratio itself will drop rather quickly. Then, a lower P/E should attract more buyers, pushing the share price up.
It's great to see that MarketAxess Holdings grew EPS by 25% in the last year. And it has bolstered its earnings per share by 24% per year over the last five years. So one might expect an above average P/E ratio.
Don't Forget: The P/E Does Not Account For Debt or Bank Deposits
The 'Price' in P/E reflects the market capitalization of the company. That means it doesn't take debt or cash into account. Theoretically, a business can improve its earnings (and produce a lower P/E in the future) by investing in growth. That means taking on debt (or spending its cash).
Such expenditure might be good or bad, in the long term, but the point here is that the balance sheet is not reflected by this ratio.
MarketAxess Holdings's Balance Sheet
Since MarketAxess Holdings holds net cash of US$409m, it can spend on growth, justifying a higher P/E ratio than otherwise.
The Verdict On MarketAxess Holdings's P/E Ratio
With a P/E ratio of 69.8, MarketAxess Holdings is expected to grow earnings very strongly in the years to come. Its strong balance sheet gives the company plenty of resources for extra growth, and it has already proven it can grow. Therefore it seems reasonable that the market would have relatively high expectations of the company
Investors should be looking to buy stocks that the market is wrong about. People often underestimate remarkable growth -- so investors can make money when fast growth is not fully appreciated. So this free report on the analyst consensus forecasts could help you make a master move on this stock.
Of course, you might find a fantastic investment by looking at a few good candidates. So take a peek at this free list of companies with modest (or no) debt, trading on a P/E below 20.
If you spot an error that warrants correction, please contact the editor at editorial-team@simplywallst.com. This article by Simply Wall St is general in nature. It does not constitute a recommendation to buy or sell any stock, and does not take account of your objectives, or your financial situation. Simply Wall St has no position in the stocks mentioned.
We aim to bring you long-term focused research analysis driven by fundamental data. Note that our analysis may not factor in the latest price-sensitive company announcements or qualitative material. Thank you for reading.
