
 Yahoo Finance
 Why Mistras Group, Inc.’s (NYSE:MG) Use Of Investor Capital Doesn’t Look Great

Today we'll look at Mistras Group, Inc. (NYSE:MG) and reflect on its potential as an investment. Specifically, we're going to calculate its Return On Capital Employed (ROCE), in the hopes of getting some insight into the business.
First up, we'll look at what ROCE is and how we calculate it. Next, we'll compare it to others in its industry. Finally, we'll look at how its current liabilities affect its ROCE.
Return On Capital Employed (ROCE): What is it?
ROCE measures the 'return' (pre-tax profit) a company generates from capital employed in its business. In general, businesses with a higher ROCE are usually better quality. In brief, it is a useful tool, but it is not without drawbacks. Author Edwin Whiting says to be careful when comparing the ROCE of different businesses, since 'No two businesses are exactly alike.'
So, How Do We Calculate ROCE?
Analysts use this formula to calculate return on capital employed:
Return on Capital Employed = Earnings Before Interest and Tax (EBIT) ÷ (Total Assets - Current Liabilities)
Or for Mistras Group:
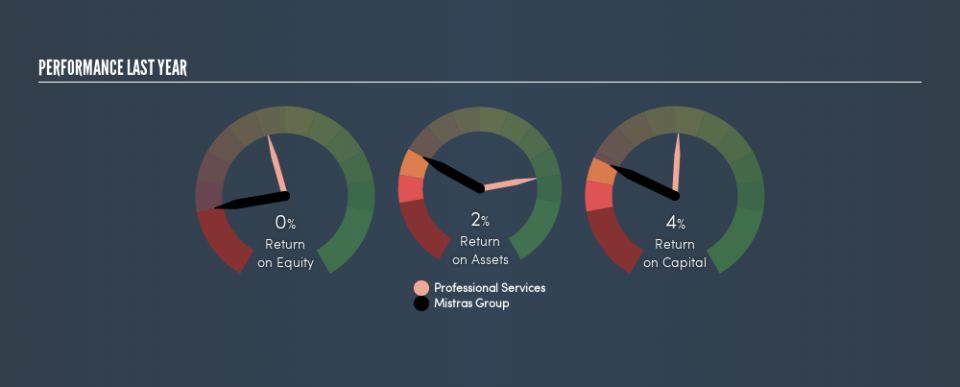
0.042 = US$26m ÷ (US$733m - US$115m) (Based on the trailing twelve months to June 2019.)
So, Mistras Group has an ROCE of 4.2%.
Check out our latest analysis for Mistras Group
Is Mistras Group's ROCE Good?
One way to assess ROCE is to compare similar companies. We can see Mistras Group's ROCE is meaningfully below the Professional Services industry average of 12%. This performance is not ideal, as it suggests the company may not be deploying its capital as effectively as some competitors. Regardless of how Mistras Group stacks up against its industry, its ROCE in absolute terms is quite low (especially compared to a bank account). Readers may wish to look for more rewarding investments.
We can see that , Mistras Group currently has an ROCE of 4.2%, less than the 12% it reported 3 years ago. Therefore we wonder if the company is facing new headwinds. You can click on the image below to see (in greater detail) how Mistras Group's past growth compares to other companies.
When considering ROCE, bear in mind that it reflects the past and does not necessarily predict the future. Companies in cyclical industries can be difficult to understand using ROCE, as returns typically look high during boom times, and low during busts. ROCE is, after all, simply a snap shot of a single year. Future performance is what matters, and you can see analyst predictions in our free report on analyst forecasts for the company.
What Are Current Liabilities, And How Do They Affect Mistras Group's ROCE?
Liabilities, such as supplier bills and bank overdrafts, are referred to as current liabilities if they need to be paid within 12 months. Due to the way the ROCE equation works, having large bills due in the near term can make it look as though a company has less capital employed, and thus a higher ROCE than usual. To counter this, investors can check if a company has high current liabilities relative to total assets.
Mistras Group has total assets of US$733m and current liabilities of US$115m. Therefore its current liabilities are equivalent to approximately 16% of its total assets. This is not a high level of current liabilities, which would not boost the ROCE by much.
Our Take On Mistras Group's ROCE
That's not a bad thing, however Mistras Group has a weak ROCE and may not be an attractive investment. You might be able to find a better investment than Mistras Group. If you want a selection of possible winners, check out this free list of interesting companies that trade on a P/E below 20 (but have proven they can grow earnings).
For those who like to find winning investments this free list of growing companies with recent insider purchasing, could be just the ticket.
We aim to bring you long-term focused research analysis driven by fundamental data. Note that our analysis may not factor in the latest price-sensitive company announcements or qualitative material.
If you spot an error that warrants correction, please contact the editor at editorial-team@simplywallst.com. This article by Simply Wall St is general in nature. It does not constitute a recommendation to buy or sell any stock, and does not take account of your objectives, or your financial situation. Simply Wall St has no position in the stocks mentioned. Thank you for reading.
