
 Yahoo Finance
 Why You Should Like Moncler S.p.A.’s (BIT:MONC) ROCE

Today we are going to look at Moncler S.p.A. (BIT:MONC) to see whether it might be an attractive investment prospect. In particular, we'll consider its Return On Capital Employed (ROCE), as that can give us insight into how profitably the company is able to employ capital in its business.
First, we'll go over how we calculate ROCE. Next, we'll compare it to others in its industry. Finally, we'll look at how its current liabilities affect its ROCE.
Return On Capital Employed (ROCE): What is it?
ROCE measures the 'return' (pre-tax profit) a company generates from capital employed in its business. All else being equal, a better business will have a higher ROCE. In brief, it is a useful tool, but it is not without drawbacks. Author Edwin Whiting says to be careful when comparing the ROCE of different businesses, since 'No two businesses are exactly alike.
So, How Do We Calculate ROCE?
The formula for calculating the return on capital employed is:
Return on Capital Employed = Earnings Before Interest and Tax (EBIT) ÷ (Total Assets - Current Liabilities)
Or for Moncler:
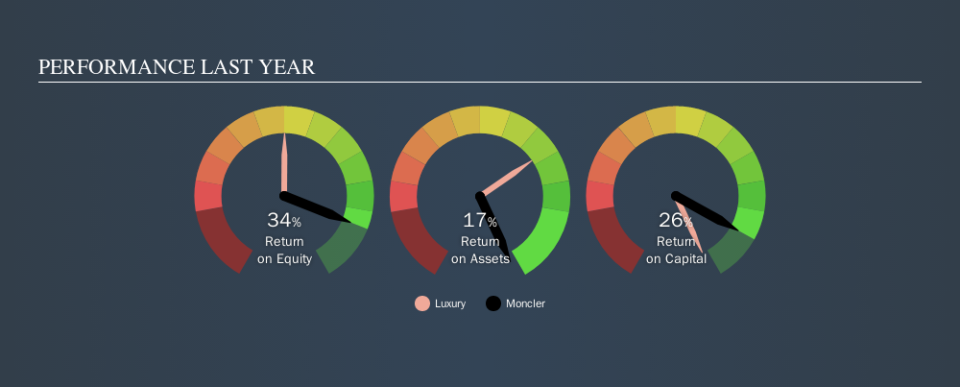
0.26 = €431m ÷ (€2.1b - €476m) (Based on the trailing twelve months to June 2019.)
Therefore, Moncler has an ROCE of 26%.
See our latest analysis for Moncler
Is Moncler's ROCE Good?
When making comparisons between similar businesses, investors may find ROCE useful. Moncler's ROCE appears to be substantially greater than the 11% average in the Luxury industry. We consider this a positive sign, because it suggests it uses capital more efficiently than similar companies. Regardless of the industry comparison, in absolute terms, Moncler's ROCE currently appears to be excellent.
Moncler's current ROCE of 26% is lower than 3 years ago, when the company reported a 36% ROCE. So investors might consider if it has had issues recently. You can see in the image below how Moncler's ROCE compares to its industry. Click to see more on past growth.
It is important to remember that ROCE shows past performance, and is not necessarily predictive. ROCE can be misleading for companies in cyclical industries, with returns looking impressive during the boom times, but very weak during the busts. This is because ROCE only looks at one year, instead of considering returns across a whole cycle. Future performance is what matters, and you can see analyst predictions in our free report on analyst forecasts for the company.
Do Moncler's Current Liabilities Skew Its ROCE?
Current liabilities are short term bills and invoices that need to be paid in 12 months or less. The ROCE equation subtracts current liabilities from capital employed, so a company with a lot of current liabilities appears to have less capital employed, and a higher ROCE than otherwise. To counter this, investors can check if a company has high current liabilities relative to total assets.
Moncler has total liabilities of €476m and total assets of €2.1b. Therefore its current liabilities are equivalent to approximately 23% of its total assets. The fairly low level of current liabilities won't have much impact on the already great ROCE.
The Bottom Line On Moncler's ROCE
Low current liabilities and high ROCE is a good combination, making Moncler look quite interesting. Moncler shapes up well under this analysis, but it is far from the only business delivering excellent numbers . You might also want to check this free collection of companies delivering excellent earnings growth.
If you like to buy stocks alongside management, then you might just love this free list of companies. (Hint: insiders have been buying them).
We aim to bring you long-term focused research analysis driven by fundamental data. Note that our analysis may not factor in the latest price-sensitive company announcements or qualitative material.
If you spot an error that warrants correction, please contact the editor at editorial-team@simplywallst.com. This article by Simply Wall St is general in nature. It does not constitute a recommendation to buy or sell any stock, and does not take account of your objectives, or your financial situation. Simply Wall St has no position in the stocks mentioned. Thank you for reading.
